Key Moments
- EUR/GBP climbed nearly 0.3% to challenge resistance around the 0.8360 area.
- Final Eurozone manufacturing PMI was revised to 52.7, with several major economies reporting stronger activity.
- UK manufacturing PMI held at 52.8, its strongest reading in five months, but failed to lend meaningful support to the Pound.
Euro Firmly Higher as Pound Momentum Weakens
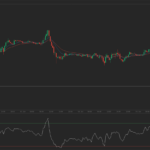
The Euro (EUR) strengthened notably against the British Pound (GBP) on Monday, helped by a pullback in Oil prices and firmer Eurozone manufacturing data. The EUR/GBP cross gained nearly 0.3% on the day and moved up to test resistance near the October 27 and 28 lows, around the 0.8360 zone.
The advance highlights a partial recovery in the Euro after recent weakness, occurring even as the Pound failed to capitalize on its own domestic data releases.
Eurozone PMI Revisions Support Single Currency
The final Eurozone HCOB manufacturing Purchasing Managers’ Index (PMI) reading was revised up to 52.7 from the earlier 52.4 estimate, narrowing the difference with September’s 52.9 outcome. Within the bloc, Germany’s final PMI aligned with expectations at 52.7.
France and Spain saw their manufacturing PMIs adjusted higher, adding to the more constructive tone in the region’s industrial sector, while Italy registered an unexpected contraction in activity.
UK Manufacturing Data Fails to Lift Sterling
In the United Kingdom, the final S&P Manufacturing PMI confirmed the preliminary reading, showing the sector expanding at a 52.8 pace in October compared with 51.9 in September. This marked the highest level in five months and reinforced expectations that the Bank of England (BoE) could raise its Bank Rate by a quarter-point on Thursday.
Despite this, the data did not translate into meaningful backing for the Pound, which underperformed against the Euro in Monday’s session.
Technical Picture: Recovery Attempts, But Upside Still Cautious
EUR/GBP last traded around 0.8356, reflecting a neutral short-term configuration, with Euro buyers still contained below a prior support-turned-resistance level. On the 4-hour chart, the Relative Strength Index (14) is hovering close to 50, indicating balanced momentum after rebounding from oversold conditions. The Moving Average Convergence Divergence (MACD) has edged slightly above the zero line, showing only a modestly positive bias and signaling consolidation rather than a firmly established trend.
For bulls, a decisive break above the 0.8360 barrier would be needed to open the door to a more sustained rebound. If this level is cleared, the October 28 high at 0.8380 could present the next resistance, while the October 26 high near 0.8400 stands out as the critical threshold to confirm a broader trend reversal.
Conversely, if the pair fails to move beyond 0.8360, sellers may regain control and push the price back toward Friday’s lows near 0.8320. A continuation lower could then bring the late February 2025 highs around 0.8300 into focus, followed by a key support band between 0.8220 and 0.8240, which corresponds to the December 2024 and February 2025 lows.
(The technical analysis of this story was written with the help of an AI tool. Know more.)
Pound Sterling Performance Against Major Currencies
The table below summarizes the British Pound’s (GBP) percentage change versus major counterparts today. According to the data, the Pound showed its strongest performance against the Australian Dollar.
| USD | EUR | GBP | JPY | CAD | AUD | NZD | CHF | |
|---|---|---|---|---|---|---|---|---|
| USD | — | -0.46% | -0.20% | 0.22% | -0.00% | 0.30% | 0.13% | -0.63% |
| EUR | 0.46% | — | 0.27% | 0.67% | 0.45% | 0.75% | 0.59% | -0.14% |
| GBP | 0.20% | -0.27% | — | 0.45% | 0.19% | 0.49% | 0.32% | -0.40% |
| JPY | -0.22% | -0.67% | -0.45% | — | -0.21% | 0.07% | -0.10% | -0.85% |
| CAD | 0.00% | -0.45% | -0.19% | 0.21% | — | 0.31% | 0.12% | -0.59% |
| AUD | -0.30% | -0.75% | -0.49% | -0.07% | -0.31% | — | -0.17% | -0.89% |
| NZD | -0.13% | -0.59% | -0.32% | 0.10% | -0.12% | 0.17% | — | -0.71% |
| CHF | 0.63% | 0.14% | 0.40% | 0.85% | 0.59% | 0.89% | 0.71% | — |
The heat map reflects how major currencies have moved relative to each other. The base currency is taken from the left-hand column and the quote currency from the top row. For instance, choosing the British Pound as the base on the left and reading across to the US Dollar column shows the percentage change for GBP (base)/USD (quote).
Important Disclaimer
Information on these pages contains forward-looking statements that involve risks and uncertainties. Markets and instruments profiled on this page are for informational purposes only and should not in any way come across as a recommendation to buy or sell in these assets. You should do your own thorough research before making any investment decisions. FXStreet does not in any way guarantee that this information is free from mistakes, errors, or material misstatements. It also does not guarantee that this information is of a timely nature. Investing in Open Markets involves a great deal of risk, including the loss of all or a portion of your investment, as well as emotional distress. All risks, losses and costs associated with investing, including total loss of principal, are your responsibility. The views and opinions expressed in this article are those of the authors and do not necessarily reflect the official policy or position of FXStreet nor its advertisers. The author will not be held responsible for information that is found at the end of links posted on this page.
 TradingPedia.com is a financial media specialized in providing daily news and education covering Forex, equities and commodities. Our academies for traders cover