Key Moments
- Copper’s 5-hour price action moved below $6.750 and is now testing a key support confluence at $6.705–$6.720.
- The medium-term trend remains technically positive with price holding above the 50-period SMA at $6.639, while the 20-period SMA at $6.795 is acting as nearby resistance.
- A 5-hour close below $6.700 is flagged as a structural breakdown for bulls, opening the way toward the $6.636–$6.635 zone.
Latest update: Sep 25, 2026, 07:11 AM UTC
This article is regularly updated during market hours.
Critical Support Zone Comes into Focus
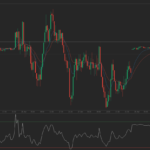
On the 5-hour chart, copper has slipped under the $6.750 line, with the latest bar trading at $6.745 versus the previous $6.761 close. That puts price directly on a dense support band at $6.705–$6.720, where trend indicators, Fibonacci levels, and prior demand converge.
Within this range, the SuperTrend, the 38.2% Fibonacci retracement, and a recent buying area all overlap. For bullish participants, holding above this corridor is seen as essential; a sustained breakdown below it would provide bears with a stronger foothold and pressure the prevailing uptrend.
Trend Structure and Short-Term Technical Barriers
From a broader 5-hour perspective, the medium-term structure is still classified as bullish. The 50-period simple moving average (SMA) is positioned at $6.639, and price is trading comfortably above that level, reinforcing the existing upward bias for now.
More tactically, the 20-period SMA at $6.795 has flipped into a near-term resistance line. Until that level is reclaimed on a closing basis, any upward attempts are likely to encounter selling pressure and may struggle to extend.
The latest 5-hour bar has formed as a doji, signaling indecision and a potential inflection point, but without a clear directional bias. At the same time, price is pressing against the upper boundary of the Ichimoku Cloud at $6.773. A clean move back below this cloud edge would be an additional warning of further downside risk.
Trading Scenarios and Key Levels
The current setup offers distinct approaches for aggressive trend followers, conservative breakout traders, and short-term momentum participants. The table below summarizes the outlined strategies:
| Bias / Style | Entry | Stop | Target 1 | R/R | Confidence | Best For |
|---|---|---|---|---|---|---|
| Aggressive Long | $6.720 | $6.635 | $6.850 | 1.53 | Medium | Trend-following bulls |
| Conservative Long | $6.805 close | $6.720 | $6.925 | 2.41 | Medium | Breakout chasers |
| Short | $6.800–6.830 | $6.870 | $6.705 | ~1.3 | Medium | Momentum traders |
Rationale Behind the Trade Map
The aggressive long stance is based on the expectation of a rebound from the SuperTrend and Fibonacci cluster in the $6.705–$6.720 support region. A defensive stop at $6.635 aligns with nearby technical protection levels.
The more conservative long approach waits for a 5-hour close above the short-term resistance barrier before engaging, seeking confirmation that buyers have regained control. This strategy aims for a higher target while maintaining a stop just under the recent support band.
On the bearish side, the short setup anticipates that rallies toward $6.800–$6.830 may fail, viewing this band as an area where recent bullish attempts have been rejected and where sellers could reassert themselves.
When the Bullish Structure Would Be Considered Broken
The analysis flags $6.700 as a critical threshold on the 5-hour timeframe. A close beneath that level would be interpreted as a decisive failure of the current bullish framework, signaling that a deeper decline could follow. The next notable downside reference points are identified at $6.636 – tied to the Ichimoku structure – and at $6.635, which also lines up with stop placement for the aggressive long strategy.
Additional bearish evidence is accumulating: MACD is described as showing active negative momentum, while the RSI reading of 52.58 is trending lower, indicating that selling pressure remains present. At the same time, trading volume is reported to be thinning out, suggesting that both bullish and bearish moves may be vulnerable to abrupt reversals and “fakeouts.”
No-Trade Band, Volatility, and Pattern in Play
A $6.730–6.790 corridor is highlighted as a high-risk, low-conviction zone. Within this range, VWAP, short-term moving averages, and multiple Ichimoku components converge, creating a congested area with elevated whipsaw potential and little directional clarity.
A potential bull flag continuation pattern is noted as being around 70% through its consolidation phase. Market participants are watching closely for either a confirmed breakout from this structure or a failed retest that could flip the narrative in favor of sellers.
Risk management remains central, with the current Average True Range (ATR) at 0.0546, or 0.81%, underscoring that price swings are meaningful enough to demand wider, more deliberate stop placements.
Strategic Takeaway for Market Participants
The analysis underscores that patience is critical at this juncture. The next roughly $0.03 move is expected to influence the 5-hour directional bias for several subsequent bars. A clear close outside the $6.705–$6.795 band is viewed as the key signal to watch; within that range, the market is effectively described as a coin-flip environment.
Once price exits this congestion zone, trade sizing and risk limits are urged to reflect the distance to protective stops. In the current choppy backdrop, underestimating volatility or overleveraging positions could leave traders exposed to sharp, adverse swings.
 TradingPedia.com is a financial media specialized in providing daily news and education covering Forex, equities and commodities. Our academies for traders cover