Key Moments
- Brett (BRETT) gains over 3% on Monday, extending a five-day rebound of more than 50% and trading above its 50-day EMA.
- Bonk (BONK) consolidates after a 28% surge on Sunday pushed the token above $0.00001000 and out of a descending wedge.
- Dogwifhat (WIF) holds above $0.40 after four days of roughly 50% recovery and a breakout above its 50-day EMA.
Memecoins Drive Market Rally Amid Geopolitical Tensions
Meme-focused cryptocurrencies Brett (BRETT), Bonk (BONK), and Dogwifhat (WIF) are at the forefront of the latest crypto market advance, logging double-digit percentage gains over the past 24 hours. The move follows the US capture of Venezuelan President Nicolás Maduro on Saturday. Price action suggests bullish participants remain in control, with technical setups indicating the potential for additional upside.
The broader digital asset complex is also strengthening against a backdrop of US President Donald Trump’s efforts to establish what is described as a new world order, which is simultaneously lending support to the US Dollar.
Brett Targets Break Above Key Resistance for Further 50% Upside
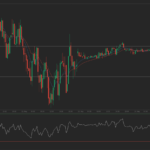
Brett is trading above its 50-day Exponential Moving Average (EMA) at $0.1786 after rebounding from an important support level at $0.01289, defined by the November 22 low. At the time of writing on Monday, BRETT is higher by more than 3% and is moving toward resistance at the December 2 peak of $0.02210.
A decisive break above $0.02210 would open the path toward the 200-day EMA at $0.03412, implying additional upside potential of over 50% from current levels.
The token’s ongoing five-session recovery has already delivered gains exceeding 50% as bullish momentum accelerates. The Relative Strength Index (RSI) is positioned at 70, touching the threshold of overbought territory while maintaining an upward trajectory. This configuration reflects stronger buying interest, and a period of consolidation with the RSI remaining elevated could allow BRETT to sustain or extend the advance.
The Moving Average Convergence Divergence (MACD) indicator has moved above the zero line and turned higher from the signal line. Rising green histogram bars further highlight increasing bullish momentum.
| BRETT Technical Levels | Price |
|---|---|
| Support – November 22 low | $0.01289 |
| Support – 50-day EMA | $0.01786 |
| Resistance – December 2 high | $0.02210 |
| Upside target – 200-day EMA | $0.03412 |
On the downside, the 50-day EMA at $0.01786 and the November 22 low at $0.01289 are likely to act as immediate support areas if the price pulls back.
Bonk Consolidates After Breakout From Descending Wedge
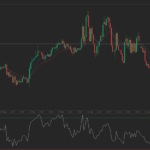
Bonk is trading nearly 1% lower on Monday at press time, pausing after a 28% rally on Sunday that carried the token above the $0.00001000 mark. The four-day climb in BONK reflects a breakout from a descending wedge pattern, with buyers now eyeing the 200-day EMA at $0.00001514 as the next potential upside objective.
Momentum indicators on the daily chart echo the strong bullish tone seen in BRETT. The RSI has moved to 73, placing it firmly in overbought territory, while the MACD has crossed above the zero line and is displaying a sequence of growing green histogram bars, indicating building positive momentum.
| BONK Technical Levels | Price |
|---|---|
| Psychological support | $0.0000100 |
| Support – 50-day EMA | $0.00000976 |
| Upside target – 200-day EMA | $0.00001514 |
If BONK retraces, the $0.0000100 psychological area is the first notable support, followed by the 50-day EMA at $0.00000976.
Dogwifhat Holds Above $0.40 After Breakout
Dogwifhat is trading comfortably above $0.40 on Monday, maintaining gains after four consecutive sessions of roughly 50% recovery. The token advanced 20% on Sunday, breaking through the 50-day EMA at $0.377 and overcoming a resistance trendline drawn from the highs on October 13 and October 27.
If the recovery continues, WIF could next target the $0.472 level, which is associated with the October 17 low.
From a technical perspective, the MACD is currently flashing a buy signal that emerged following a crossover on Saturday. The RSI stands at 61, signaling strengthening buying pressure while leaving room for further appreciation before entering overbought territory.
| WIF Technical Levels | Price |
|---|---|
| Support – 50-day EMA | $0.377 |
| Current key level | $0.40 |
| Upside target | $0.472 |
| Potential downside target | $0.300 |
On the downside, a move back below the 50-day EMA at $0.377 would undermine the recent breakout, raising the risk of a pullback toward the $0.300 round-number area.