Key moments
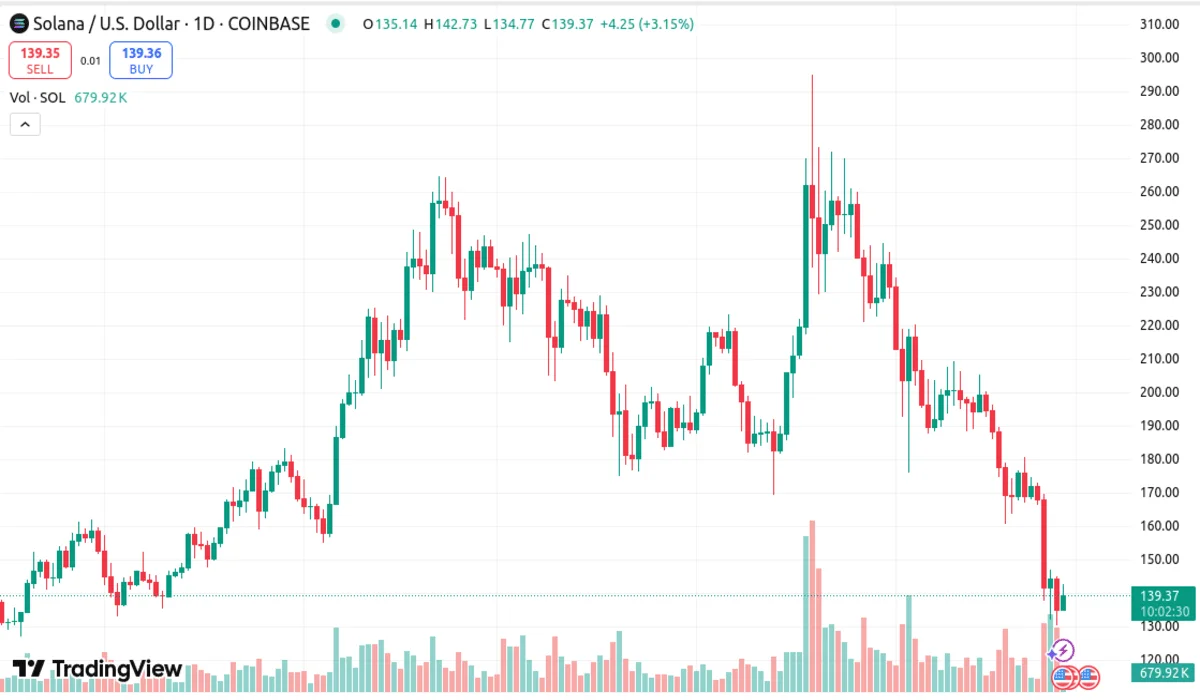
- Solana’s price has experienced a sharp decline, falling to around $134 on February 27th, and is struggling to regain its footing. The cryptocurrency’s value currently hovers at $139.
- The Relative Strength Index (RSI) has plummeted to its lowest level since June 2023, dropping below the 30 threshold.
- The recent listing of Solana futures ETFs has introduced a potential catalyst for recovery, as it may attract institutional investors and provide a new investment avenue.
On February 27th, the price of Solana (SOL) plummeted to a low of roughly $134, marking a significant decline in its value. This downturn was accompanied by a notable drop in the Relative Strength Index (RSI) to below 30, a level that indicates the currency is oversold.
A low RSI often signals that the selling pressure may be exhausted, and a potential price rebound could be on the horizon. At the time of writing, the price of Solana hovers around $139, still relatively low compared to previous highs and the $200+ it reached earlier this month. The current market sentiment is also at its lowest point in over a year, with many investors exhibiting extreme bearish sentiment.
The road to recovery is uncertain, and the cryptocurrency still faces significant headwinds. Investor confidence remains under pressure due to two key factors: the anticipated release of FTX estate tokens, which is likely to increase market supply, and growing macroeconomic concerns triggered by US President Donald Trump’s introduction of new tariffs on international imports.
Despite these setbacks, February also saw the launch of Solana futures ETFs by the Depository Trust & Clearing Corporation (DTCC). The introduction of new products, such as the Volatility Shares 2x Solana ETF (SOLT) and the Volatility Shares Solana ETF (SOLZ), marks a significant milestone as the first investment vehicles tailored to provide access to Solana’s futures market. Although this move does not ensure regulatory clearance, it hints at a possible shift towards broader institutional acceptance.
From a technical standpoint, indicators such as the MACD and Parabolic SAR suggest a bearish trend, with the price hovering near the lower end of the Bollinger Band. Although a strong close above the middle Bollinger Band could potentially trigger a bullish turnaround, the cryptocurrency’s current downtrend remains a significant obstacle, leaving it vulnerable to a potential drop to $130 unless it can break free from this pattern.