AUD/USD held in proximity to recent 11-week highs on Tuesday, while drawing support from an extended bullish move in global commodity prices.
Prices of iron ore, Australia’s key export resource, rose 10% to an all-time high of over $200 per tonne, while the steel-making material brought in AUD 150 billion during the year to March.
“The “melt up” in commodity prices over the last week has added significant weight to that view that the A$ remains undervalued,” Richard Franulovich, head of Forex strategy at Westpac, was quoted as saying by Reuters.
“We used the dip below $0.7680 earlier last week as an opportunity to trigger our buy recommendation. Dips should now be limited into the $0.7785 and $0.7820 region.”
Meanwhile, the US Dollar hovered in proximity to multi-month lows against a basket of six major peers on Tuesday, but market players remained rather cautious ahead of the release of US CPI inflation data tomorrow. Higher-than-expected figures could prompt the Federal Reserve to scale back monetary policy support sooner and upcoming speeches by Fed officials, including John Williams at 14:30 GMT and Lael Brainard at 16:00 GMT today, will be closely watched for clues over how the central bank perceives the current macro conditions.
A consensus of analyst estimates points to a 3.6% year-on-year increase in US consumer prices in April due to the base effect of a pandemic year contraction.
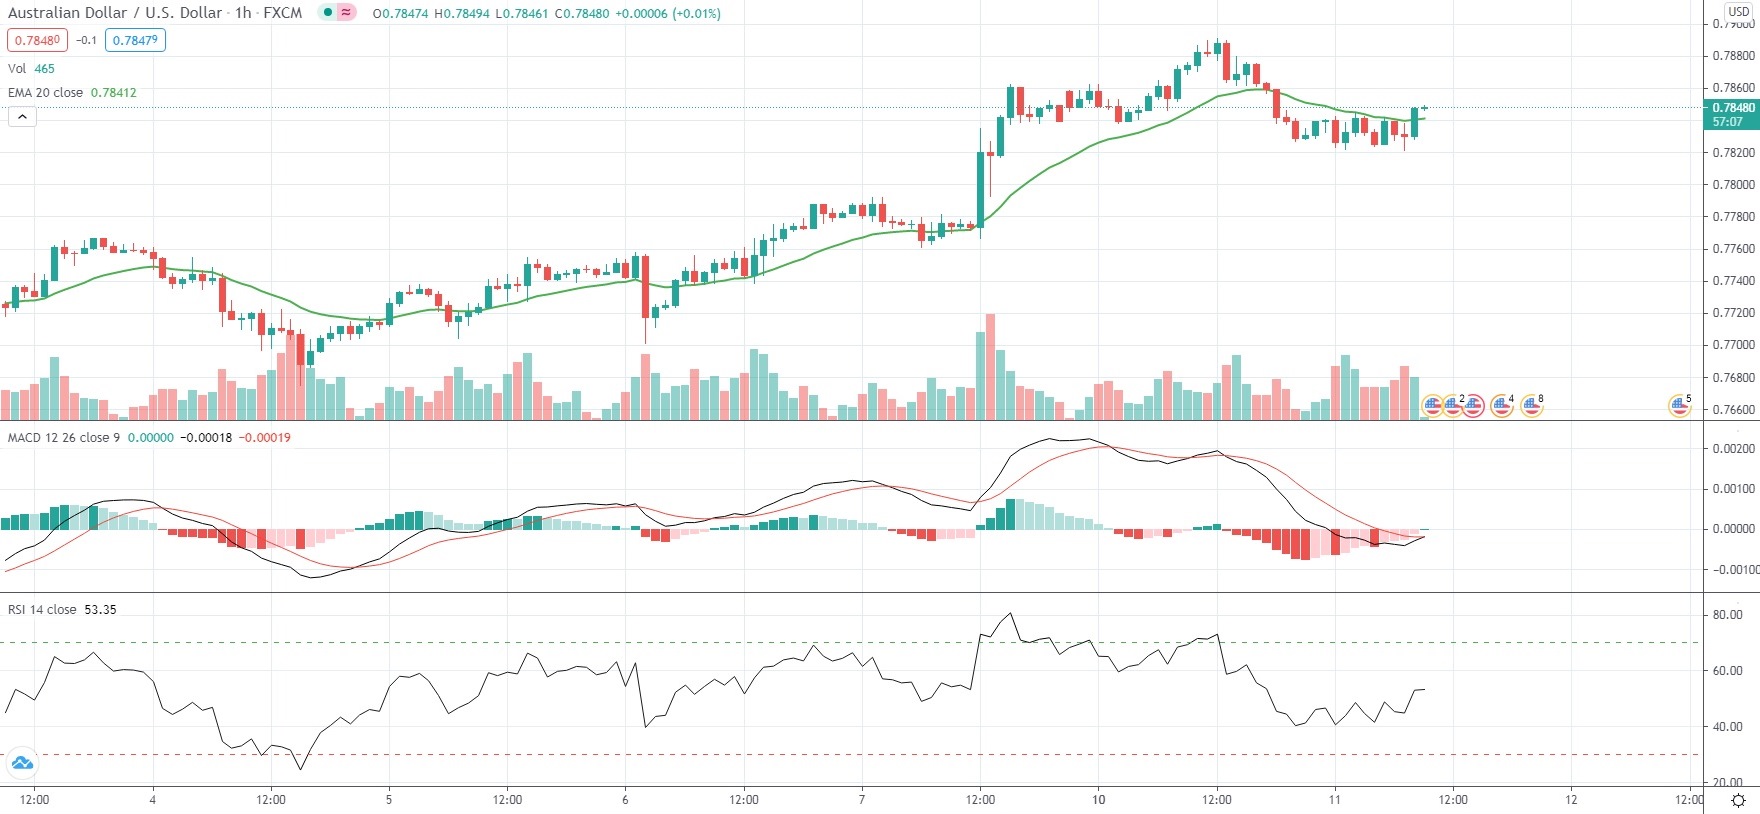
As of 8:20 GMT on Tuesday AUD/USD was inching up 0.08% to trade at 0.7835, while moving within a daily range of 0.7821-0.7845. Yesterday the currency pair climbed as high as 0.7891, or its strongest level since February 25th (0.8007). The major pair has appreciated 1.59% so far in May, following another 1.53% surge in April.
Bond Yield Spread
The spread between 2-year Australian and 2-year US bond yields, which reflects the flow of funds in a short term, equaled -6.88 basis points (-0.0688%) as of 8:15 GMT on Tuesday, down from -6.4 basis points on May 10th.
Daily Pivot Levels (traditional method of calculation)
Central Pivot – 0.7849
R1 – 0.7871
R2 – 0.7913
R3 – 0.7934
R4 – 0.7956
S1 – 0.7807
S2 – 0.7785
S3 – 0.7743
S4 – 0.7701