The price chart for cryptocurrency ethereum displays bullish patterns despite the recent correction.
Ethereum’s Price Chart Framed with Price Channels
Going back to 2019, ethereum price has (for the most part) been contained within parallel price channels.
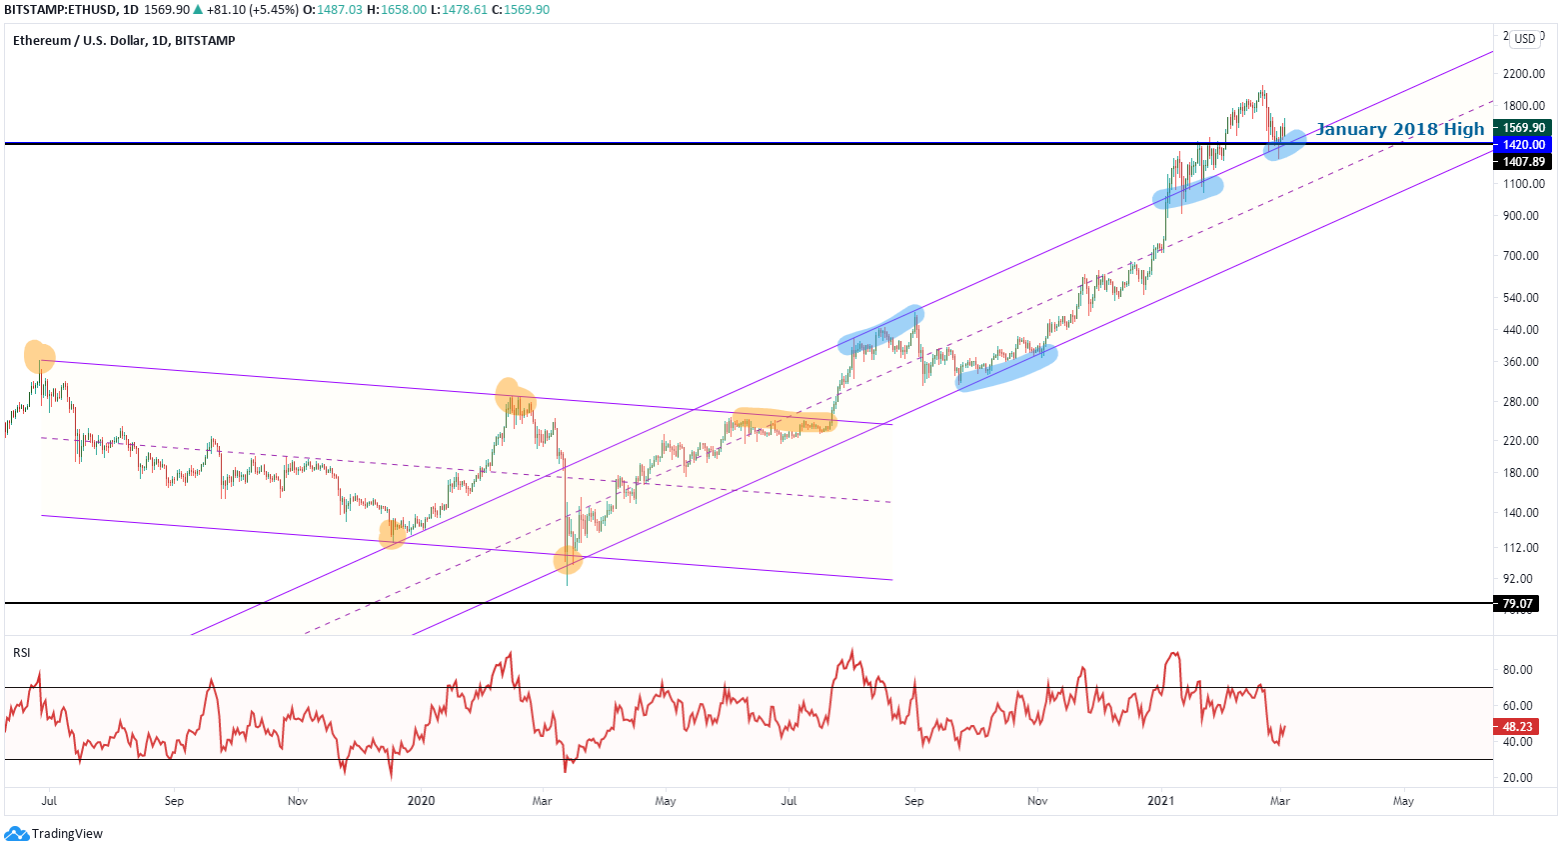
Looking at the chart below, we can see price following the downward sloping price channel from June 2019 to July 2020 (orange highlights). When prices did finally rally in March 2020, ETHUSD clearly paused at the resistance trend line of the channel as Ethereum price was paying its respect to the formation.
However, ethereum prices eventually popped up outside of this channel and began to carve its own new channel (blue highlights).
Ethereum’s Respect for Parallel Price Channels
(click on image to enlarge)
Ethereum Support and Resistance Levels
There are several touches of the support and resistance line among this newly created channel. An interesting note is that in early January 2021, ethereum prices popped higher above the resistance trend line of the channel. As we know from support and resistance chart reading, what was old resistance, when broken, becomes new support.
Sure enough, beginning in 2021, this old resistance channel line is behaving like a new support line for ETHUSD pricing.
Watch ETHUSD Key Levels for 2021
ETHUSD Price and It’s All-Time High
On February 28, ETHUSD prices hit a low of $1293, then bounced hard to the upside. There was a strong technical reason for the bounce. First, ETHUSD price was guarded by the resistance channel trend line as we mentioned a moment ago.
Secondly, previous all-time high in ETHUSD prior to January was $1420. When ethereum prices broke higher into new all-time high territory, this broken resistance at $1420 would act like new support. Sure enough, when prices dove lower on February 23 and February 28, both days experienced a strong rebound as this new support level is helping to hold prices up.
Receive clear analysis and education on chart reading. Get access now by joining the Trading Price newsletter for no charge.
ETHUSD Price Forecast
We don’t know for sure if ETHUSD prices will continue higher. However, the price low of $1293 from February 28 is an important level.
So long as ETHUSD holds above $1293, it is possible to see this cryptocurrency work higher into new all-time highs.
In fact, if we look at the king of crypto, Bitcoin’s price retracement simply dropped it to support too.
If ETHUSD prices fall below $1293, then you would have prices breaking down below the channel support line AND breaking below previous support near $1420.
A breakdown below $1293, though not expected, would be a huge red flag and call into question if the uptrend is still in force.
Bottom line, look for new all-time highs while holding above $1293.
Interested in learning more about how to read charts of Ethereum, bitcoin and other markets? Become a TradingPedia Insider by joining the Trading Price Newsletter and receive clear analysis and education twice per week.