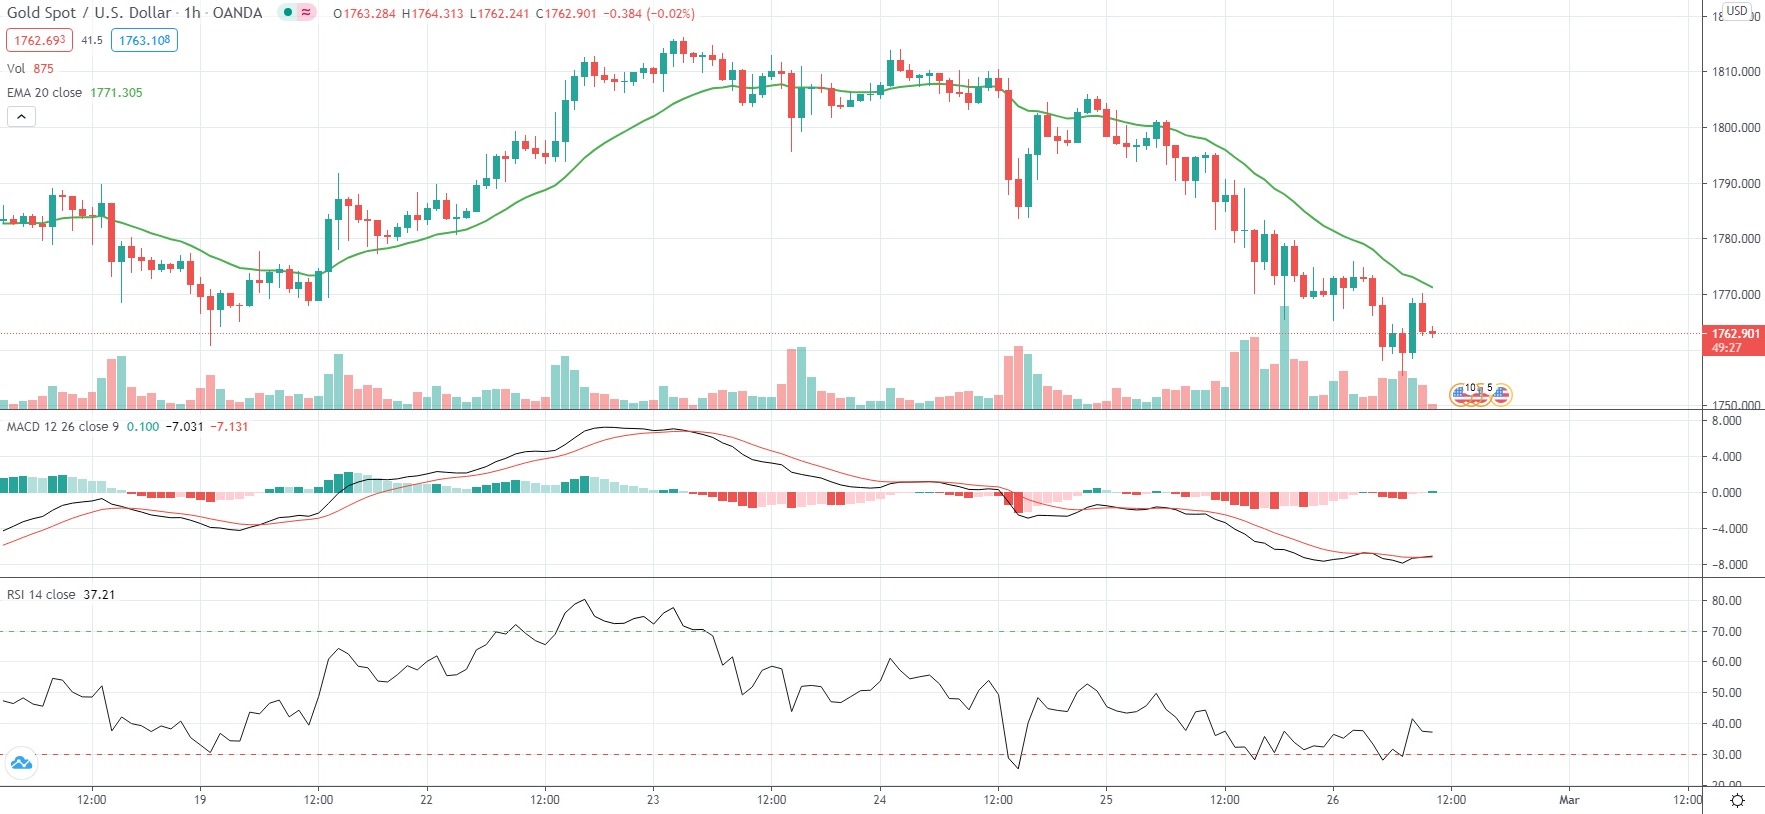
Spot Gold extended losses from the previous three trading days on Friday, while hitting a fresh eight-month low, as optimistic macroeconomic outlook and higher inflation expectations gave US bond yields a boost.
The commodity was also poised to register its second straight week of losses and the worst monthly performance since November 2020.
Yesterday the yellow metal retreated almost 2%, which marked its worst single-day performance since February 4th, as 10-year US government bond yields rose to their highest level since the start of the coronavirus pandemic, which provided support to the US Dollar.
The yield on the benchmark 10-year Treasury note went up as high as 1.539% yesterday and finished the trading session at a 52-week high of 1.513%.
“Rising inflation expectations as markets price in the reopening of developed market economies are pushing yields higher and pressuring gold,” Jeffrey Halley, senior market analyst at OANDA, was quoted as saying by Reuters.
“The overall picture looks dire, gold is now in danger of a material move lower, if yields rise again,” he added.
Although Gold is used as a hedge against inflation, higher inflation expectations also tend to bolster bond yields, which in turn leads to higher opportunity cost of holding the non-yielding precious metal.
As of 10:06 GMT on Friday Spot Gold was edging down 0.44% to trade at $1,762.75 per troy ounce, after earlier touching an intraday low of $1,755.43 per troy ounce, or its weakest price level since June 26th 2020 ($1,747.57 per troy ounce). The commodity has retreated 4.57% so far in February, following another 2.67% drop in January.
Meanwhile, Gold futures for delivery in April were retreating 0.70% on the day to trade at $1,763.00 per troy ounce, while Silver futures for delivery in March were down 2.47% to trade at $26.955 per troy ounce.
The US Dollar Index, which reflects the relative strength of the greenback against a basket of six other major currencies, was edging up 0.38% to 90.48 on Friday, while rebounding from Thursday’s seven-week low of 89.68.
In terms of macroeconomic data, today Gold traders will be paying attention to the January report on US personal income, personal spending and Core PCE inflation due out at 13:30 GMT as well as to the February data on manufacturing conditions in the Chicago area due out at 14:45 GMT.
Near-term investor interest rate expectations were without change. According to CME’s FedWatch Tool, as of February 26th, investors saw a 100.0% chance of the Federal Reserve keeping borrowing costs at the current 0%-0.25% level at its policy meeting on March 16th-17th, or unchanged compared to February 25th.
Daily Pivot Levels (traditional method of calculation)
Central Pivot – $1,780.54
R1 – $1,795.54
R2 – $1,820.53
R3 – $1,835.52
R4 – $1,850.52
S1 – $1,755.55
S2 – $1,740.56
S3 – $1,715.57
S4 – $1,690.58
 TradingPedia.com is a financial media specialized in providing daily news and education covering Forex, equities and commodities. Our academies for traders cover