Bitcoin’s price performance has started off the year with a bang and the price charts still look long-term bullish.
At the time of this writing, Bitcoin’s YTD performance against the USD shows a 71% increase. As we approach the final days of February, it is shaping up to be a solid month too with a 47% gain.
For those that followed our long-term forecast for bitcoin and what levels to consider for 2021, we illustrated a price channel and how the mid-line of the price channel may provide temporary resistance. Well, earlier in January, price did correct lower from the mid-line and has subsequently pushed higher.
Bitcoin price chart from 2014 to 2021
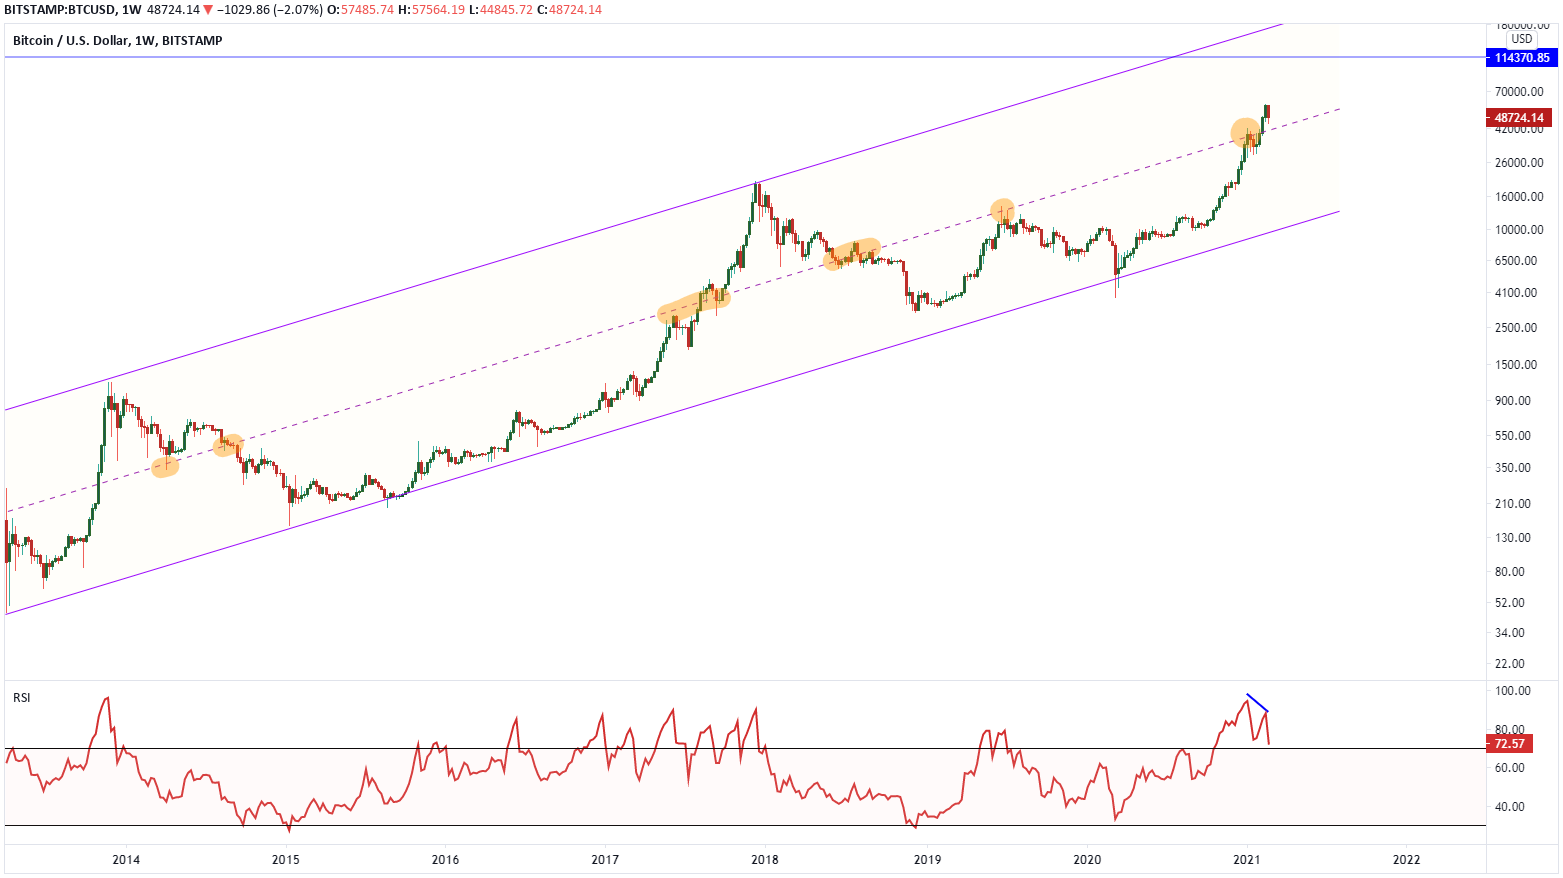
(click image to enlarge)
After this recent buying spree, Bitcoin has gone through another corrective dip down to $44,845 this week.
Bitcoin’s Technical Analysis Forecast
Using chart reading and technical analysis as our guide the 23% corrective dip this week’s fits nicely within the charts.
You see, when bitcoin prices reversed near $42,000 on January 8, there was a significant level of resistance which was created.
Bitcoin’s Old Resistance Turned into New Support
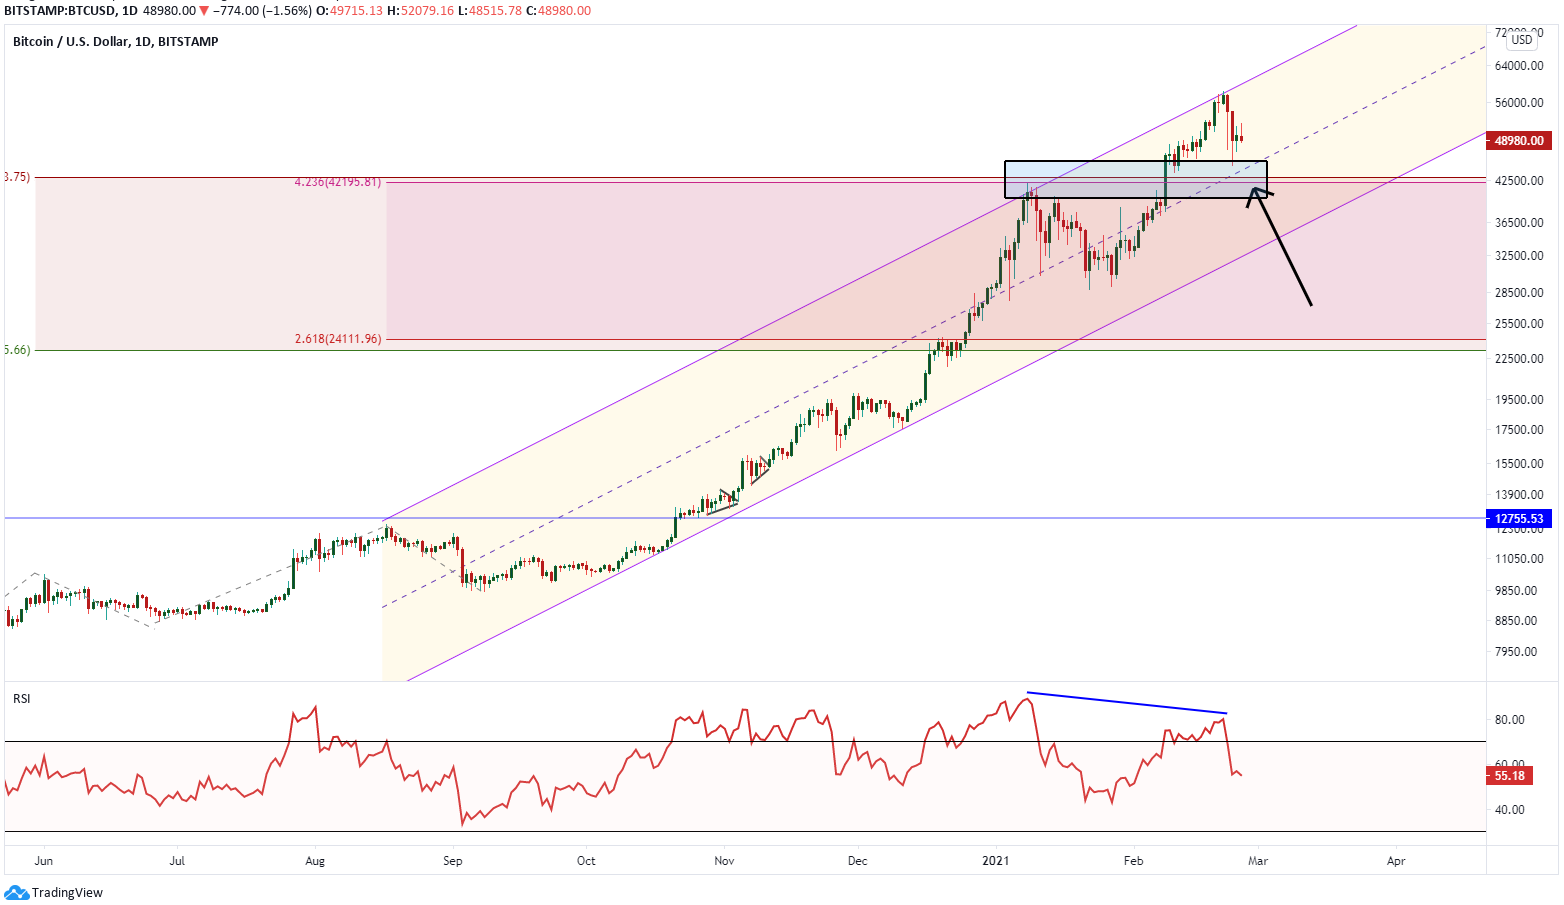
(click image to enlarge)
First, using the Fibonacci extension tool, $42,000 represented the 1.618 extension of the March 2020 to June 2020 up trend.
Secondly, $42,000 also represents the lesser known 4.236 extension of the June to August 2020 uptrend.
Lastly, in addition to the wave measurements, the longer-term channel mid-line rolled through at a similar price zone.
This confluence of wave measurements created a reaction in the market. This reaction in the market created a strong level of resistance.
After bitcoin prices corrected lower in January, the king of crypto gathered steam to break out to new all-time highs.
This is where things get really interesting.
You see, once resistance is broken, many times prices will pull back to the broken resistance level offering another opportunity to jump into the trade.
The bitcoin price correction from earlier this week came close to the point of breakout. We cannot rule out a further correction of price. If that takes place, look for bitcoin prices to find support near $42,000.
If this $42,000 key level cannot contain bitcoin’s prices, then the next level of support is down near $28,000-$30,000.
If bitcoin is successful in finding support, then look for the uptrend to continue to new highs above $60,000.
Bitcoin Trading Frequently Asked Questions
Since bitcoin and other alt coins are so new, is technical analysis and chart reading accurate?
Yes, technical analysis can be accurate with some limitations. First, if you consider what technical analysis really is, you are gaining a sense of the sentiment of the market via price action. The more participants (the bigger the market), then you tend to see a better picture. A smaller market will have more inconsistencies with technical analysis.
Bitcoin and other big cryptocurrencies have an advantage in technical analysis as they have grown into sizeable markets. Bitcoin’s market capitalization is now worth over $1 trillion.
Interested in learning more about how to read charts of bitcoin and other markets? Become a TradingPedia Insider by joining the Trading Price Newsletter and receive clear analysis and education twice per week.