Join our community of traders FOR FREE!

  • Learn
  • Improve yourself
  • Get Rewards
Learn More

NZD/USD has faced strong resistance in the area just below the 0.6600 mark since early July, with the daily chart visualizing the formation of a possible Double Top, marked by the high from June 10th (0.6585) and the high from July 9th (0.6601).

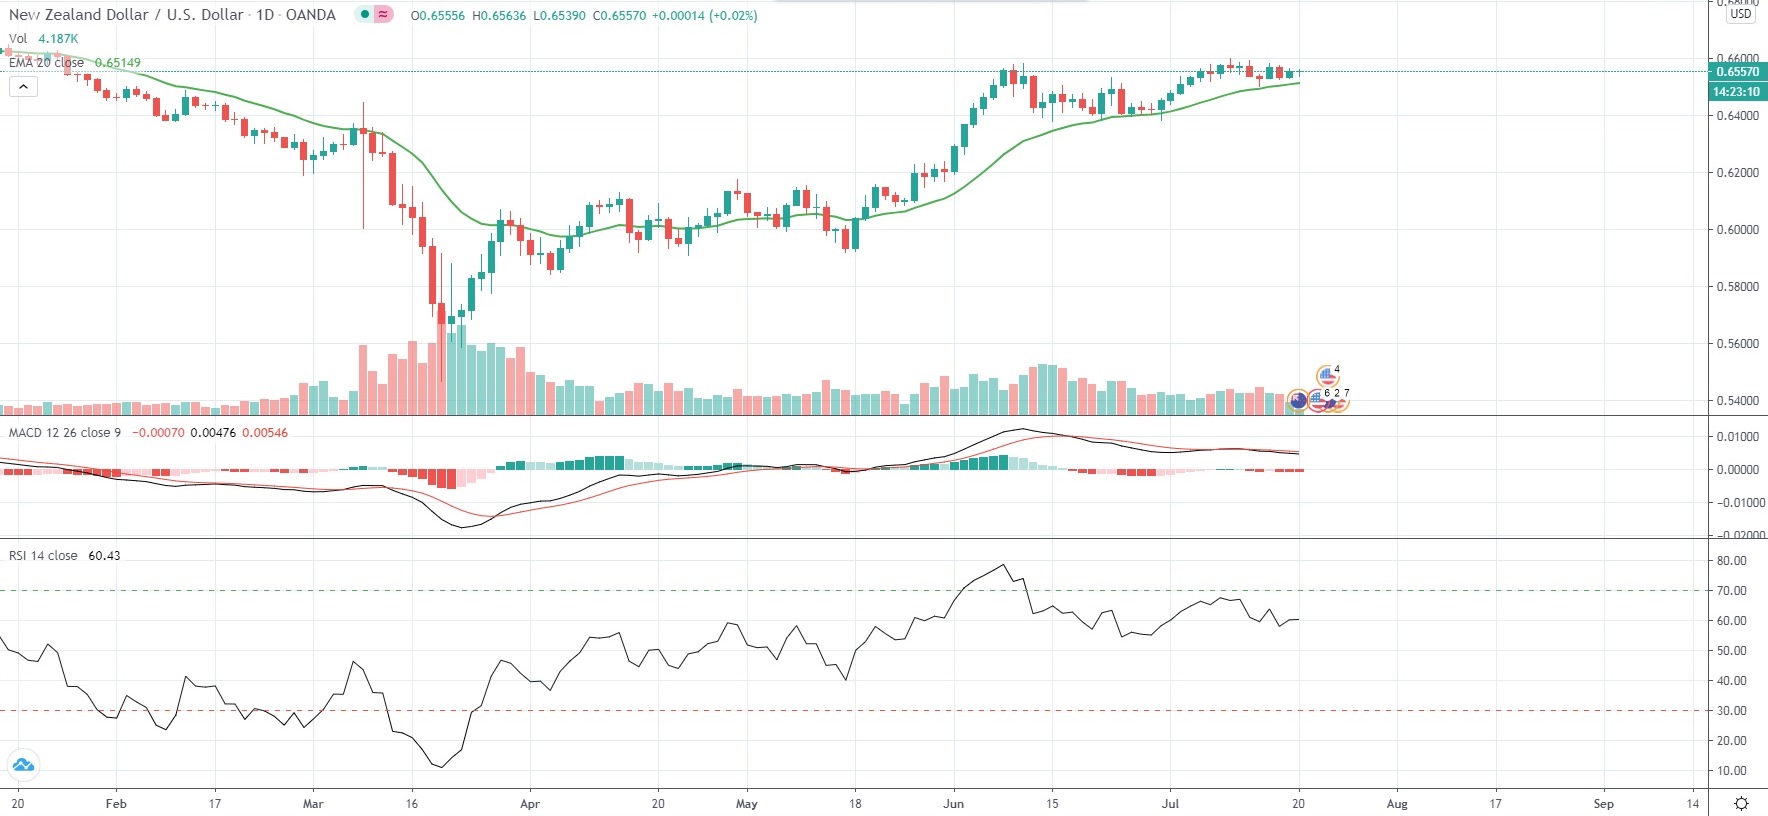
The daily chart also showcases a bearish divergence between NZD/USD exchange rate and the 14-period RSI. Therefore, a break and close below the 20-period EMA (0.6515) may expose the low from July 14th (0.6503), while a break below that level may drive the pair lower for a test of the 0.6380-0.6410 area, where it had previously received support.

On the other hand, a break and close above the high from July 9th (0.6601) may expose the high from January 16th (0.6665) and then the yearly high of 0.6739 (registered on January 2nd).

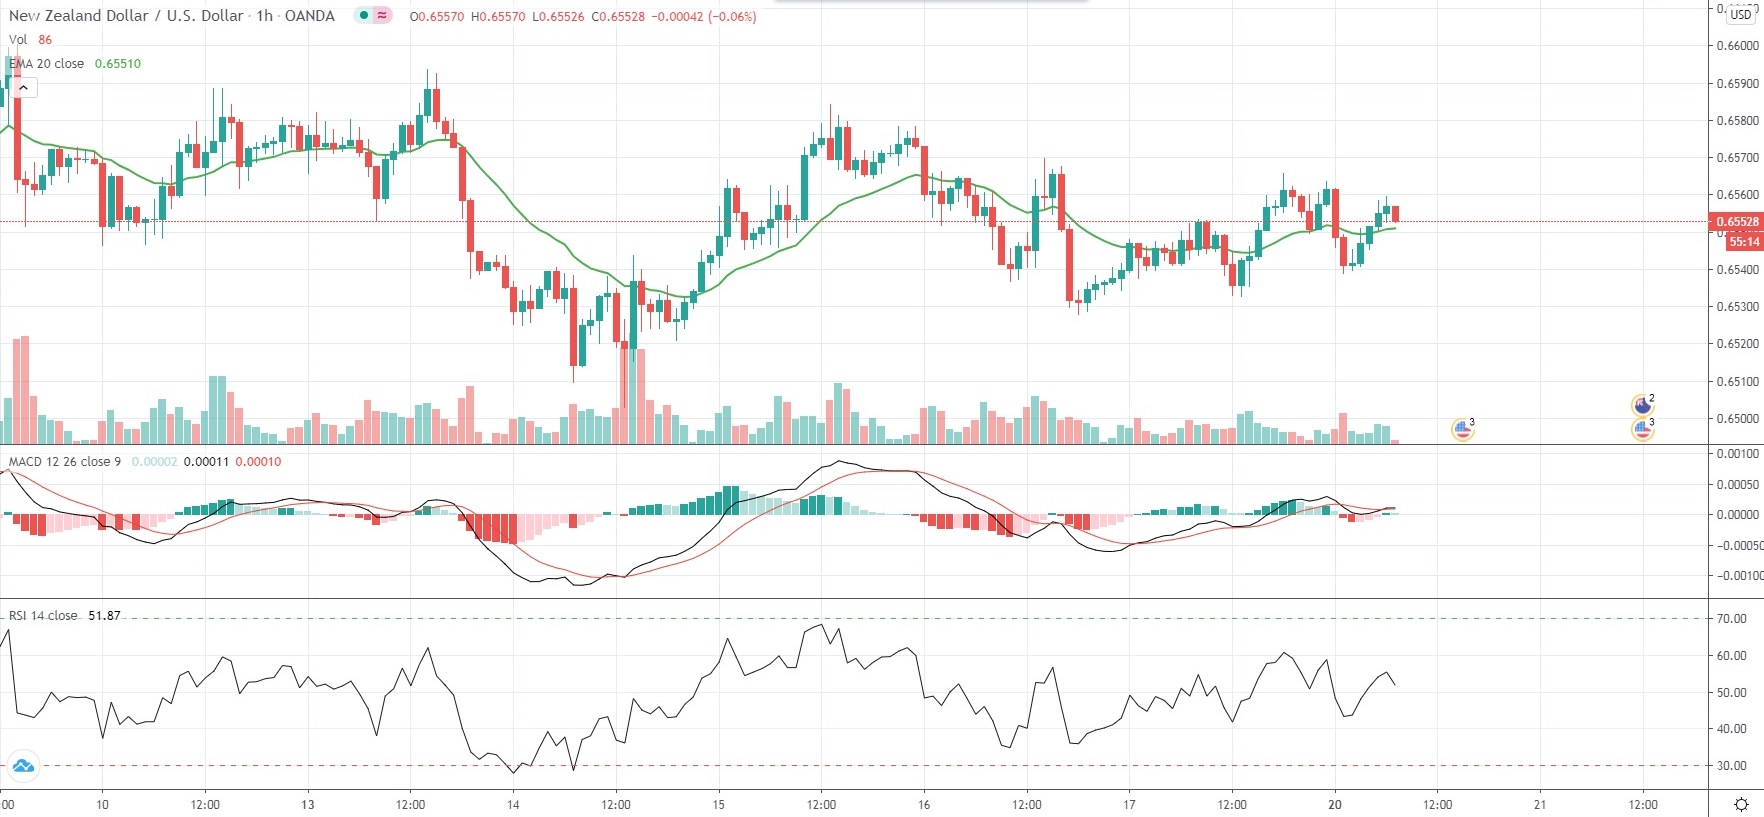
As of 6:58 GMT on Monday NZD/USD was inching up 0.02% to trade at 0.6557, while moving within a daily range of 0.6539-0.6564. The major pair lost 0.28% last week, as it snapped a three-week streak of gains.

In terms of macroeconomic calendar, no relevant reports, which may affect NZD/USD valuation, are scheduled to be released on Monday, while trade may be driven mostly by sentiment.

Bond Yield Spread

The spread between 1-year New Zealand and 1-year US bond yields, which reflects the flow of funds in a short term, equaled 9.2 basis points (0.092%) as of 6:15 GMT on Monday, down from 10.4 basis points on July 17th.

Daily Pivot Levels (traditional method of calculation)

Central Pivot – 0.6551
R1 – 0.6570
R2 – 0.6584
R3 – 0.6603
R4 – 0.6622

S1 – 0.6537
S2 – 0.6518
S3 – 0.6504
S4 – 0.6489

TradingPedia.com is a financial media specialized in providing daily news and education covering Forex, equities and commodities. Our academies for traders cover Forex, Price Action and Social Trading.

Related News

  • Natural gas trading outlook: futures edge up on cold North, EIA data eyedNatural gas trading outlook: futures edge up on cold North, EIA data eyed Natural gas rose for a second day as weather forecasts continued to call for below-usual readings across the northern US, with more cold systems to come. However, gains were capped as the rest of the country enjoys seasonal or warmer […]
  • Major Currency Pairs: Pivot Levels for Thursday (January 26th 2017)Major Currency Pairs: Pivot Levels for Thursday (January 26th 2017) USD/CHFR1 – 0.9997 R2 – 1.0002 R3 (Range Resistance - Sell) – 1.0008 R4 (Long Breakout) – 1.0025 R5 (Breakout Target 1) - 1.0045 R6 (Breakout Target 2) - 1.0053S1 – 0.9985 S2 – 0.9980 S3 (Range Support - Buy) – 0.9974 S4 […]
  • Silver extends losses on QE outlookSilver extends losses on QE outlook Silver tracked golds downward direction and extended losses on Monday, trading near its 33-month low.On the Comex division of the New York Mercantile Exchange, silver futures for September delivery fell 1.43% for the day. The precious […]
  • Gold futures set for best weekly performance in three on downbeat U.S. data, Yellen commentsGold futures set for best weekly performance in three on downbeat U.S. data, Yellen comments Gold retained gains in late European trading after the U.S. Department of Labor reported that more Americans than projected filed for initial unemployment benefits last week. Applications fell but an upward revision to the preceding periods […]
  • Nomura Sees EUR/GBP Upside on UK Data, Politics ShiftNomura Sees EUR/GBP Upside on UK Data, Politics Shift Key Moments Nomura analysts maintain a constructive stance on EUR/GBP as UK wage and inflation trends indicate further monetary policy convergence with the Euro area. Recent UK inflation figures have slightly reduced the […]
  • Gold gains as dollar slidesGold gains as dollar slides Gold futures for August delivery were 0,5% up on the day on the Comex division of the New York Mercantile Exchange and traded at $1 386,25 a troy ounce, following a 0,8% surge earlier in the day.Golds gain was supported by the weakened […]