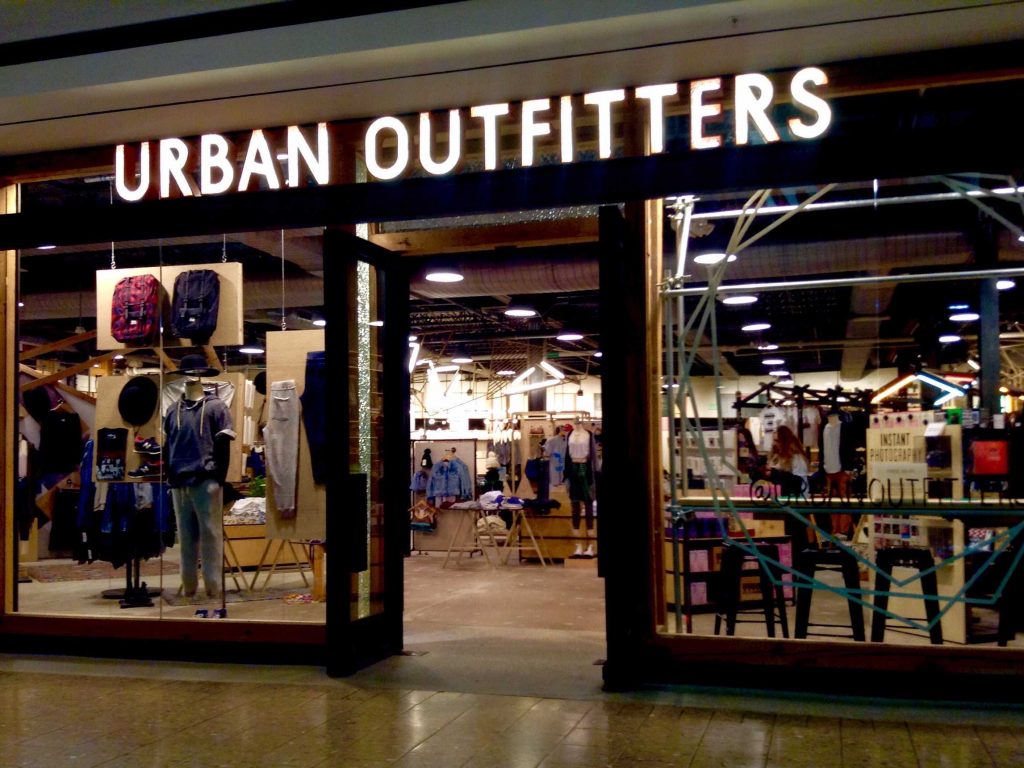
On March 8th Urban Outfitters Inc (URBN) reported lower-than-anticipated earnings per share during the quarter ended on December 30th, while its comparable sales were flat.
Urban Outfitters shares closed lower for a fourth straight trading session on Wednesday. The stock went down 2.60% ($0.66) to $24.75, after touching an intraday low at $22.87, or a price level not seen since February 2nd 2016 ($22.84). In the week ended on March 5th the shares of the lifestyle specialty retailer lost 3.05% of their market value compared to a week ago, which marked a second consecutive period of decline and also the worst performance since the week ended on January 8th. The stock has extended its slump to 4.92% so far during the current month, following a 1.92% drop in February. The latter has been a sixth consecutive month of losses. For the entire past year, the shares of the NASDAQ-listed retailer gained 25.19%.
The retailers earnings per share were reported at $0.55 during the fourth quarter of 2016. In comparison, the median forecast by analysts had pointed to earnings of $0.56 per share.
At the same time, the companys net sales rose 1.7% to $1.032 million during Q4 compared to the same period a year earlier. However, the actual figure again fell short of market expectations ($1.037 million).
On the other hand, the retailers comparable sales remained unchanged during the period. Richard Hayne, Urban Outfitters Chief Executive Officer, said that “higher markdowns than expected” mounted pressure on holiday season sales.
“The U.S. market is oversaturated with retail space and far too much of that space is occupied by stores selling apparel”, Hayne was quoted as saying by Reuters. “Retail square feet per capita in the United States is more than six times that of Europe or Japan. And this doesn’t count digital commerce.”
Daily and Weekly Pivot Levels
With the help of the Camarilla calculation method, todays levels of importance for the Urban Outfitters stock are presented as follows:
R1 – $24.93
R2 – $25.11
R3 (Range Resistance – Sell) – $25.29
R4 (Long Breakout) – $25.84
R5 (Breakout Target 1) – $26.47
R6 (Breakout Target 2) – $26.89
S1 – $24.57
S2 – $24.39
S3 (Range Support – Buy) – $24.21
S4 (Short Breakout) – $23.66
S5 (Breakout Target 1) – $23.03
S6 (Breakout Target 2) – $22.61
By using the traditional method of calculation, the weekly levels of importance for Urban Outfitters Inc (URBN) are presented as follows:
Central Pivot Point – $26.05
R1 – $27.08
R2 – $28.11
R3 – $29.14
R4 – $30.18
S1 – $25.02
S2 – $23.99
S3 – $22.96
S4 – $21.94


