On Monday gold for delivery in June traded within the range of $1,262.30-$1,286.50. Futures closed at $1,264.15, plummeting 2.24% from Friday’s close. It has been the 33rd drop in the past 69 trading days and also the steepest one since December 17th 2015, when the yellow metal lost 2.52% of its value. The daily low has been the lowest price level since April 28th, when a low of $1,238.50 was recorded. The precious metal has dropped 1.67% so far during the current month, following four consecutive months of advance.
On the Comex division of the New York Mercantile Exchange, gold futures for delivery in June were edging up 0.26% on Tuesday to trade at $1,267.45 per troy ounce. The precious metal went up as high as $1,269.45 during the early phase of the European trading session, while the current daily low was at $1,261.00 per troy ounce, recorded during early Asian trade.
Gold seemed to have received a boost on Monday following the remarks made by the Fed President for Chicago, Charles Evans. According to the FOMC member, US macroeconomic indicators remain solid, while the economy may grow at a rate of 2.5% in 2016. Evans also expressed his support of the current “wait and see” stance by the Federal Reserve.
Meanwhile, earlier on Tuesday it became clear that Chinese annualized consumer inflation remained at 2.3% for a third straight month in April, missing the market consensus, which pointed to a slight increase to 2.4%. The Consumer Price Index was supported by a 7.4% surge in politically sensitive food prices in April. Cost of consumer goods rose 2.5% year-on-year during the month, while cost of services went up 2.0%. At the same time, annual producer prices in the country fell 3.4% in April, or at the slowest rate since November 2014, following a 4.3% drop in March. The annualized Producer Price Index has been in a decline since March 2012.
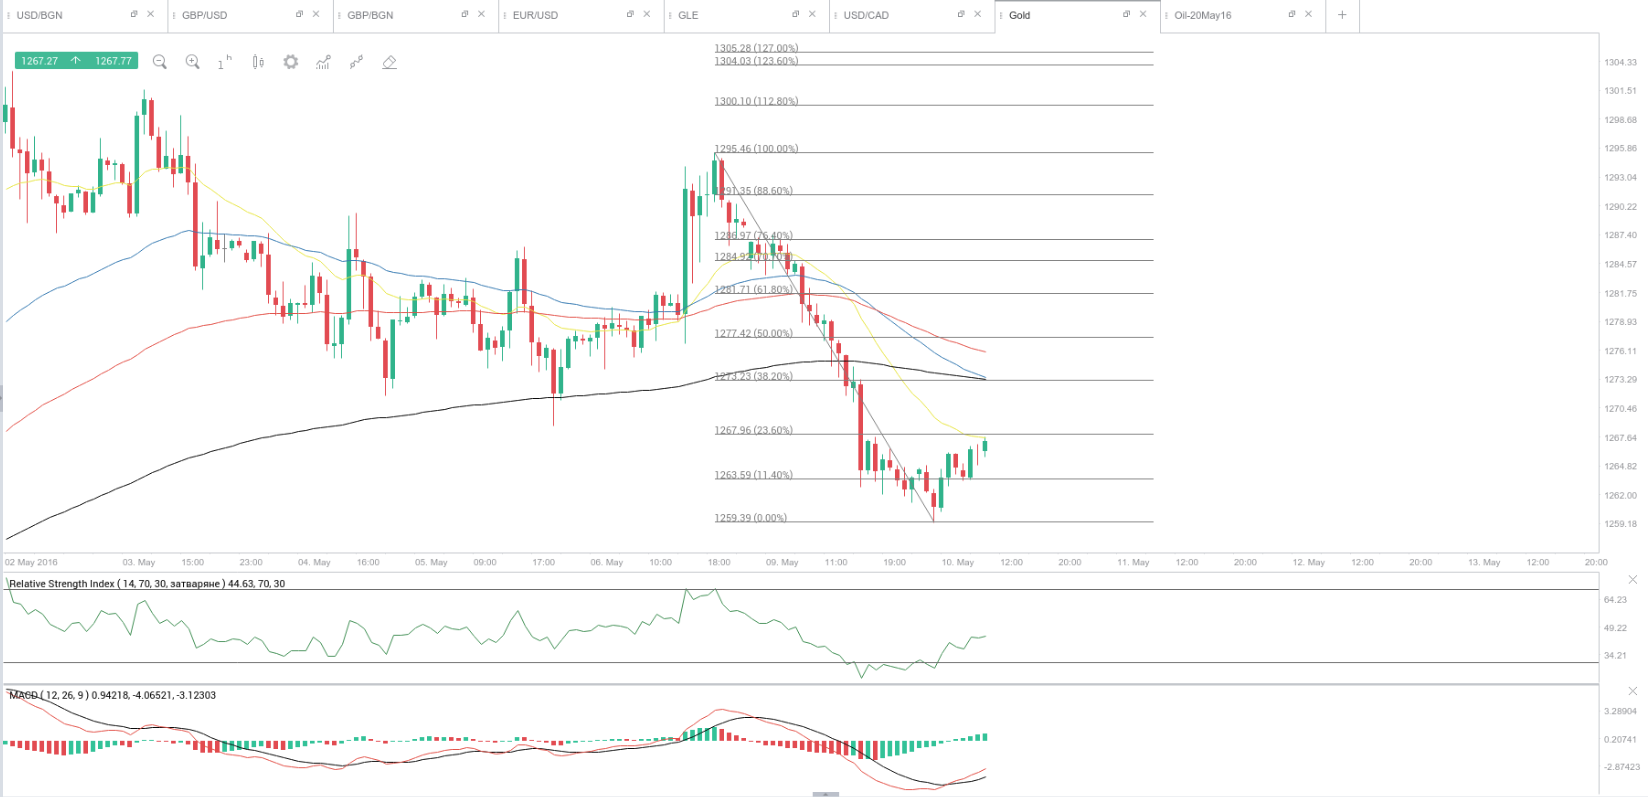
The precious metal came off recent almost 2-week lows, as momentum has turned bullish, while the 14-period RSI is nearing its key 50.00 level. The move up, however, may be restrained, with possible areas of resistance being the hourly 21-period Exponential Moving Average ($1,267.58), and then the 38.2% Fibonacci level, reflecting the descent from May 6th high to May 10th low/the hourly 200-period EMA ($1,273.23/$1,273.34). Support may be expected in the area around the current daily low ($1,261.00) and then – at the low from April 28th ($1,238.50). The formation of a “perfect order” of the hourly 21-period, the 55-period, the 100-period and the 200-period EMAs would indicate further bearish strength.
Meanwhile, silver futures for delivery in July were gaining 0.47% on the day to trade at $17.090 per troy ounce, after going up as high as $17.160 a troy ounce during the early phase of the European trading session.
Daily and Weekly Pivot Levels
By employing the traditional calculation method, the daily pivot levels for gold are presented as follows:
Central Pivot Point – $1,270.98
R1 – $1,279.67
R2 – $1,295.18
R3 – $1,303.87
S1 – $1,255.47
S2 – $1,246.78
S3 – $1,231.27
By using the traditional method of calculation again, the weekly pivot levels for gold are presented as follows:
Central Pivot Point – $1,289.37
R1 – $1,307.93
R2 – $1,322.97
R3 – $1,341.53
S1 – $1,274.33
S2 – $1,255.77
S3 – $1,240.73