On Friday gold for delivery in June traded within the range of $1,276.90-$1,295.60. Futures closed at $1,292.90, advancing 1.69% from Thursday’s close. It has been the 36th gain in the past 68 trading days and also the steepest one since April 29th, when the yellow metal added 1.87% to its value. The daily high has been the highest price level since May 3rd, when a high of $1,301.50 was recorded. In weekly terms, gold edged up 0.29% during the past week. It has been the 10th gain in the past 18 weeks and also a second consecutive one. The precious metal has tumbled 0.66% so far during the current month, following four consecutive months of advance. In April it rose 4.46%.
On the Comex division of the New York Mercantile Exchange, gold futures for delivery in June were losing 0.57% on Monday to trade at $1,280.35 per troy ounce. The precious metal went up as high as $1,289.55 during the early phase of the Asian trading session, while the current daily low was at $1,279.75 per troy ounce, recorded during early European trade.
Today the precious metal may be influenced by the remarks by Charles Evans, Fed President for Chicago and also a FOMC member. He is scheduled to speak at 9:10 GMT.
Last Friday the Federal Reserve President for New York, William Dudley, noted that it was still reasonable to anticipate 2 hikes in borrowing costs in 2016, in spite of the weakest US employment growth since September 2015, that was reported for April. Employers in all sectors of economy with the exclusion of the farming industry added 160 000 new jobs last month, the Bureau of Labor Statistics (BLS) said on May 6th, while the rate of unemployment remained stable at 5.0%.
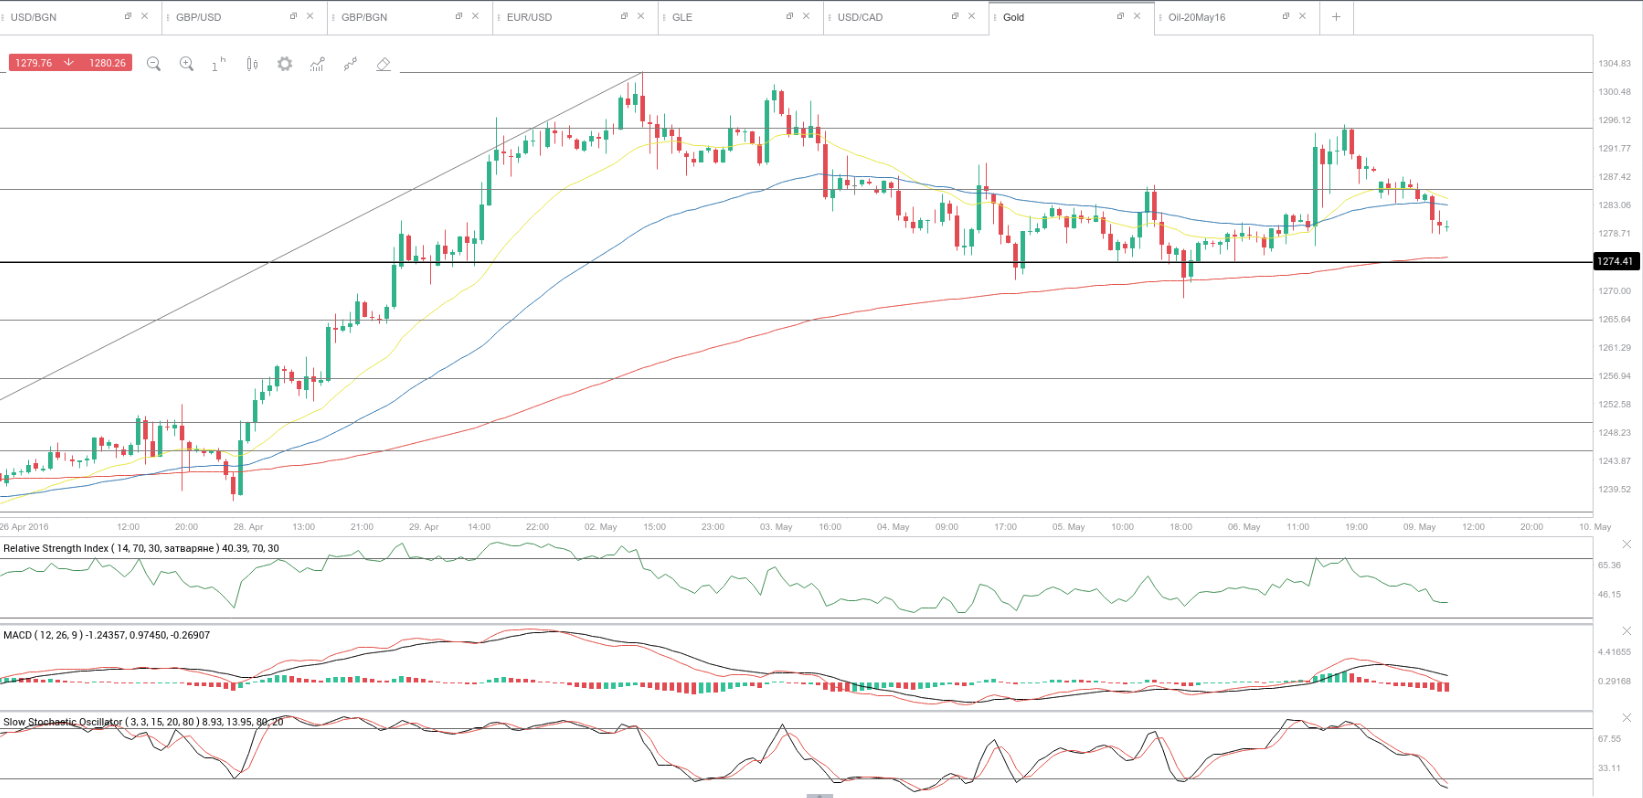
As can be observed on the hourly time frame below, the commodity is poised to test the 38.2% Fibonacci level ($1,274.41), which reflects the ascent from April 22nd low to May 2nd high, for a third time in the past few trading days, as momentum has turned bearish and the 14-period RSI has fallen below 50.00. If gold overcomes that key level, the next support may be expected at the low from May 5th ($1,270.80). A break and close below it may expose the low from April 29th ($1,267.20). Resistance, on the other hand, may be expected at the hourly 55-period Exponential Moving Average ($1,282.95) and then – at the current daily high ($1,289.55).
Meanwhile, silver futures for delivery in July were losing 0.23% on the day to trade at $17.410 per troy ounce, after going down to as low as $17.370 a troy ounce during the early phase of the European trading session.
Daily and Weekly Pivot Levels
By employing the traditional calculation method, the daily pivot levels for gold are presented as follows:
Central Pivot Point – $1,288.47
R1 – $1,300.03
R2 – $1,307.17
R3 – $1,318.73
S1 – $1,281.33
S2 – $1,269.77
S3 – $1,262.63
By using the traditional method of calculation again, the weekly pivot levels for gold are presented as follows:
Central Pivot Point – $1,289.37
R1 – $1,307.93
R2 – $1,322.97
R3 – $1,341.53
S1 – $1,274.33
S2 – $1,255.77
S3 – $1,240.73