On Tuesday gold for delivery in June traded within the range of $1,233.00-$1,245.70. Futures closed at $1,244.40, going up 0.44% on a daily basis. It has been the 31st gain in the past 60 trading days and also a second consecutive one. The precious metal has increased its advance to 1.09% so far during the current month, following three consecutive months of gains.
On the Comex division of the New York Mercantile Exchange, gold futures for delivery in June were edging up 0.28% on Wednesday to trade at $1,247.85 per troy ounce. The precious metal went up as high as $1,249.30 during the early phase of the European trading session, while the current daily low was at $1,243.50 per troy ounce, recorded during early Asian trade.
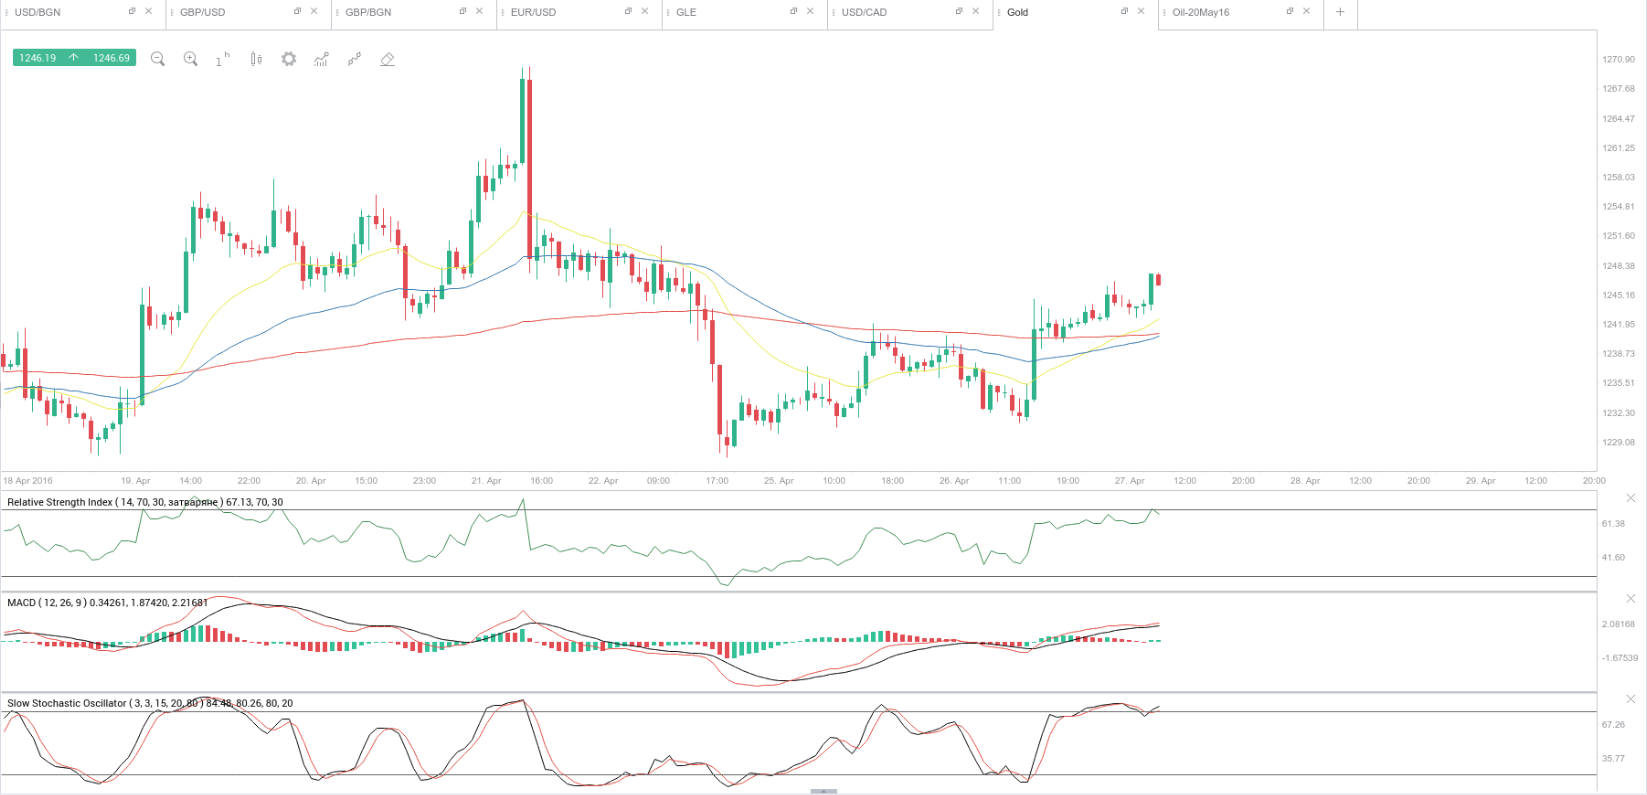
On the hourly time frame, the 21-period, the 55-period and the 200-period Exponential Moving Averages are about to form a perfect order, while momentum has turned bullish again. A further advance may send gold up for a test of April 21st high ($1,252.30). Support, on the other hand, may be received at the hourly 21-period EMA ($1,242.50) and then – at the hourly 200-period EMA ($1,240.91).
Today the precious metal may be strongly influenced by the Federal Reserve Banks decision on policy. The Federal Open Market Committee (FOMC) will probably keep the target range for the federal funds rate intact between 0.25% and 0.50% at its two-day policy meeting, scheduled to be concluded today, according to the median forecast by experts. In March the target range was left intact. Policy makers stressed on the moderate-paced expansion in economic activity, but, however, estimates of US growth and PCE inflation were revised down. Economy is now projected to expand 2.2% in 2016 (down from 2.4% as expected in December), 2.1% in 2017 (down from 2.2% as expected in December) and 2.0% in 2018 (unchanged from December’s estimate). The Personal Consumption Expenditure Price Index is now projected to rise 1.2% in 2016 (down from a 1.6% surge as expected in December), 1.9% in 2017 (unchanged from December) and 2.0% in 2018 (also unchanged from December’s estimate).
Maintaining the current policy stance would support gold, as it would be more appealing to investors compared to high-yielding assets.
A separate report may show that pending home sales in the United States rose 0.5% in March from a month ago. In February pending home sales increased 3.5%, or the most since February 2015, when sales surged at a revised up 3.6%. In case pending home sales increased at a slower pace than anticipated, this would have a moderate bearish effect on the US dollar and a moderate bullish effect on gold. The National Association of Realtor’s (NAR) will report on the official index performance at 14:00 GMT.
Meanwhile, silver futures for delivery in May were gaining 0.96% on the day to trade at $17.355 per troy ounce, after going up as high as $17.425 a troy ounce during the early phase of the European trading session. The latter has been the highest price level since April 21st, when futures registered a high of $17.720 a troy ounce.
Daily and Weekly Pivot Levels
By employing the traditional calculation method, the daily pivot levels for gold are presented as follows:
Central Pivot Point – $1,241.03
R1 – $1,249.07
R2 – $1,253.73
R3 – $1,261.77
S1 – $1,236.37
S2 – $1,228.33
S3 – $1,223.67
By using the traditional method of calculation again, the weekly pivot levels for gold are presented as follows:
Central Pivot Point – $1,242.43
R1 – $1,256.87
R2 – $1,285.03
R3 – $1,299.47
S1 – $1,214.27
S2 – $1,199.83
S3 – $1,171.67