 On Tuesday gold for delivery in June traded within the range of $1,228.80-$1,256.20. Futures closed at $1,251.40, surging 1.44% on a daily basis. It has been the 28th gain in the past 55 trading days. The daily high has been the highest price level since April 13th, when a high of $1,256.90 was recorded. The precious metal has risen 1.26% so far during the current month, following three consecutive months of advance.
On the Comex division of the New York Mercantile Exchange, gold futures for delivery in June were edging down 0.15% on Wednesday to trade at $1,249.50 per troy ounce. The precious metal went up as high as $1,259.80 during the early phase of the Asian trading session, while the current daily low was at $1,247.50 per troy ounce, recorded during late Asian trade.
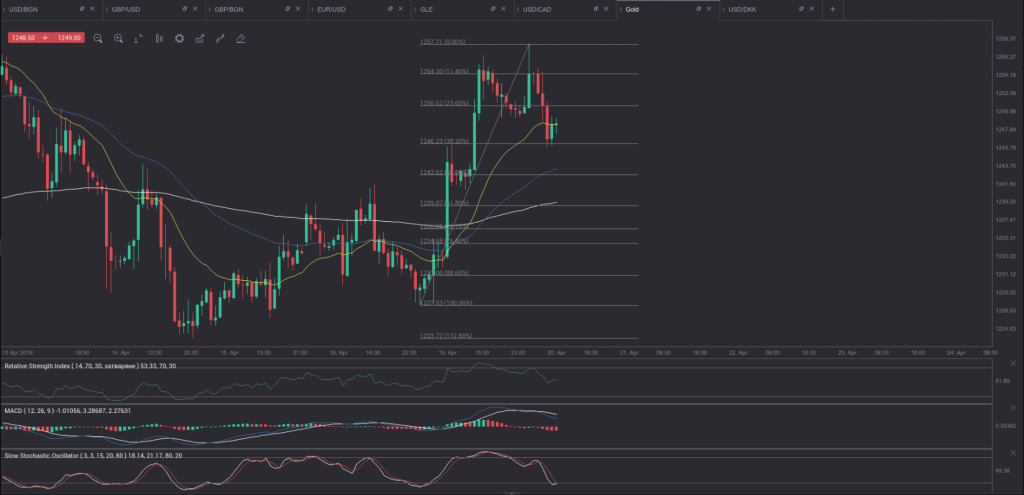
The commodity came off highs unseen since April 12th during Wednesdays Asian trade, as the 14-period RSI signaled overbought conditions. The down move, that followed was halted at the 38.2% Fibonacci level, reflecting the ascent from April 19th low to April 20th high. Since the perfect order of the 21-day, 55-day and 200-day EMAs still holds, while the RSI remains above 50.00, it is reasonable to expect further advance in a short term. Additionally, the hourly Slow Stochastic Oscillator is poised to generate a bullish signal. If we see further upside, the commodity may encounter resistance at the current daily high ($1,259.80) and then – at the high from April 12th ($1,261.70). If, however, bearish momentum continues to persist, support may be observed at the 55-period EMA ($1,243.30) and then – at the 200-day EMA ($1,239.51).
Meanwhile, silver futures for delivery in May were losing 0.48% on the day to trade at $16.895 per troy ounce, after going down as low as $16.855 a troy ounce during the late phase of the Asian trading session.
Daily and Weekly Pivot Levels
By employing the traditional calculation method, the daily pivot levels for gold are presented as follows:
Central Pivot Point – $1,245.47
R1 – $1,262.13
R2 – $1,272.87
R3 – $1,289.53
S1 – $1,234.73
S2 – $1,218.07
S3 – $1,207.33
By using the traditional method of calculation again, the weekly pivot levels for gold are presented as follows:
Central Pivot Point – $1,239.77
R1 – $1,255.03
R2 – $1,276.97
R3 – $1,292.23
S1 – $1,217.83
S2 – $1,202.57
S3 – $1,180.63


