Yesterday’s trade saw USD/CAD within the range of 1.3287-1.3418. The pair closed at 1.3301, down 0.14% on a daily basis. It has been the first drop in the past six trading days. The daily high has been the highest level since June 30th 2004, when a high of 1.3502 was registered.
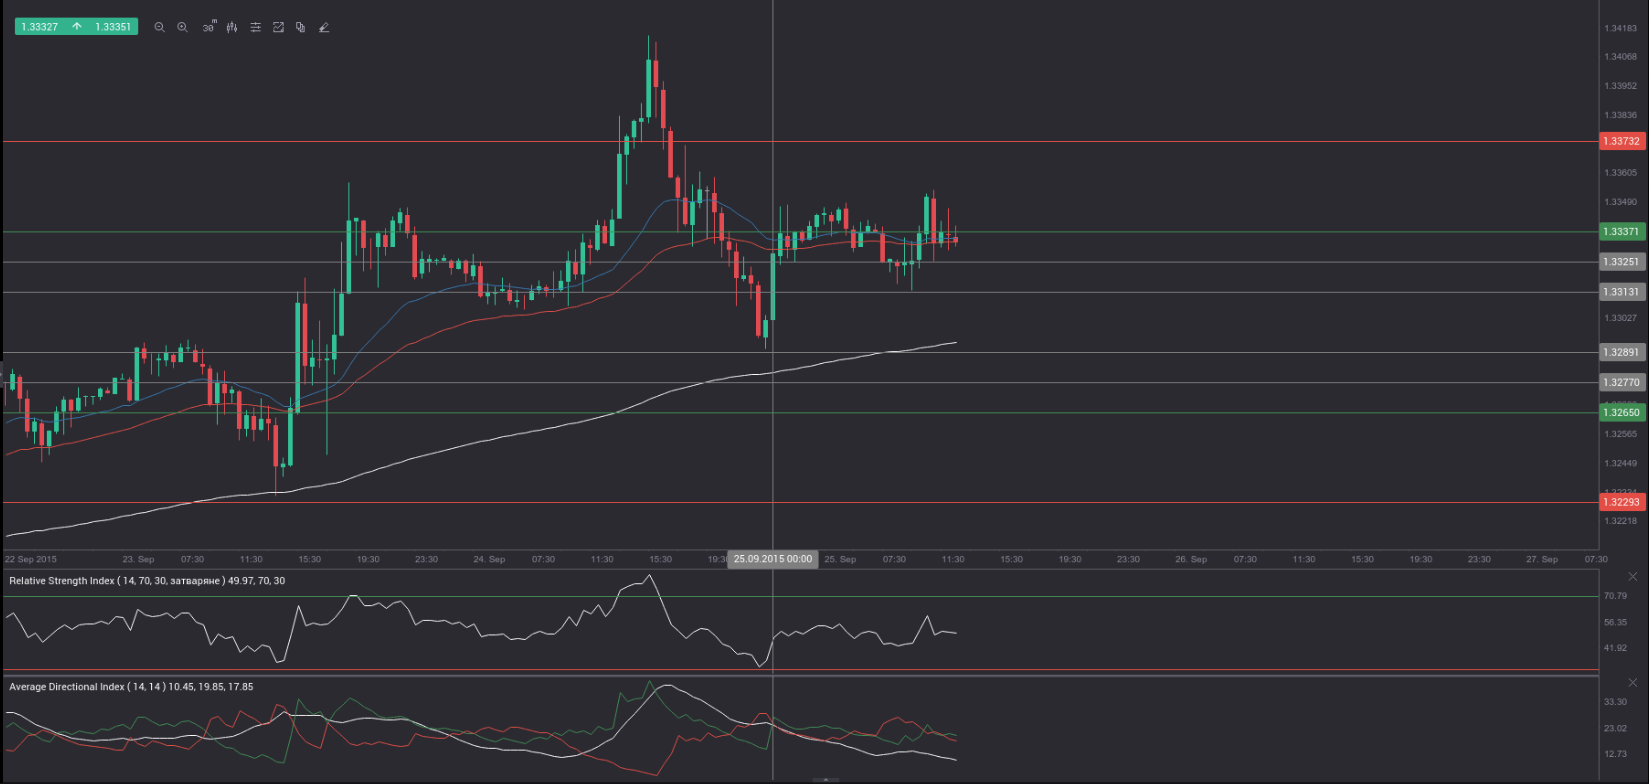
At 8:55 GMT today USD/CAD was gaining 0.24% for the day to trade at 1.3338. The pair touched a daily high at 1.3356 at 8:01 GMT, testing the high from September 23rd. The longer-term bull trend is still valid. In case the pair overcomes the daily R4 level (1.3373), a test of 1.3400 may be at hand. A break above that key round number may send the cross up for a test of yesterdays high (1.3418).
Today the cross may be influenced by a number of macroeconomic reports as listed below.
Fundamentals
United States
Gross Domestic Product – final estimate
The final estimate of the US Gross Domestic Product probably pointed to an annualized rate of growth of 3.7% in the second quarter of 2015. If so, it would confirm the 2nd GDP estimate, reported on August 27th. The 2nd estimate outpaced the preliminary one, because of higher business spending and faster build up of inventories, according to the Bureau of Economic Analysis.
According to the August 27th report, non-residential fixed asset investment expanded 3.2% in Q2. The preliminary estimate pointed to a 0.6% drop. Investment in non-residential structures rose 3.1% in Q2, while the preliminary estimate pointed to a 1.6% decrease. Equipment investment shrank less than expected, at a pace of 0.4%, compared to a 4.1% drop pointed by the preliminary estimate. The accumulation of inventories in Q2 was revised up to USD 121.1 billion, from the preliminary USD 110.0 billion. This way it contributed 0.22% to growth instead of shedding 0.08% as pointed by the advance estimate. In addition, personal consumption expenditures rose at a faster pace in Q2, 3.1% compared to a preliminary 2.9% increase.
In case the final GDP growth rate exceeded the median forecast by experts, this would cause a strong bullish impact on the greenback. The official data by the Bureau of Economic Analysis are to be released at 12:30 GMT.
Services PMI by Markit – preliminary estimate
Activity in the US sector of services probably slowed down in September, with the corresponding preliminary Purchasing Managers’ Index coming in at a reading of 55.6. If so, this would be the lowest index reading since June, when the PMI stood at a final 54.8. In August the final seasonally adjusted PMI came in at 56.1, up from a preliminary value of 55.2. The PMI is based on data collected from a representative panel of more than 400 private sector companies, which encompasses industries such as transport and communication, financial intermediaries, business and personal services, computing & IT and hotels and restaurants. Values above the key level of 50.0 indicate optimism (expanding activity). In case, however, a larger-than-projected slowdown in services sector activity was reported, this would have a moderate bearish effect on the US dollar. The preliminary data by Markit Economics is due out at 13:45 GMT.
Reuters/Michigan Consumer Sentiment Index – final estimate
The monthly survey by Thomson Reuters and the University of Michigan may show that consumer confidence in the United States lowered for a third consecutive month in September. The final reading of the corresponding index, which usually comes out two weeks after the preliminary data, probably came in at 86.9, up from a preliminary value of 85.7. If market expectations were met, this would be the lowest level since October 2014, when the gauge of sentiment was reported at a final 86.9. In August the gauge of confidence came in at a final reading of 91.9, down from a preliminary value of 92.9. The survey encompasses about 500 respondents throughout the country. The index is comprised by two major components, a gauge of current conditions and a gauge of expectations. The current conditions index is based on the answers to two standard questions, while the index of expectations is based on three standard questions. All five questions have an equal weight in determining the value of the overall index.
According to preliminary data, the sub-index of current economic conditions, which measures US consumers’ views of their personal finances, decreased to a reading of 100.3 in September from a final 105.1 in August. The sub-index of consumer expectations plunged to a flash reading of 76.4 in September, down from a final value of 83.4 in August. According to survey results, American citizens expect that the inflation rate will reach 2.9% in 2016, up from a rate of 2.8%, as pointed in the August survey.
In case the gauge of consumer sentiment showed a larger decrease than anticipated, this would have a moderate bearish effect on the dollar. The final reading is due out at 14:00 GMT.
Bond Yield Spread
The yield on Canadian 2-year government bonds went as high as 0.532% on September 24th, or the highest level since September 21st (0.532%), after which it slid to 0.510% at the close to lose 0.006 percentage point compared to September 23rd.
The yield on US 2-year government bonds climbed as high as 0.715% on September 24th, or the highest level since September 22nd (0.719%), after which it fell to 0.621% at the close to lose 8.2 basis points (0.082 percentage point) for the day.
The spread between 2-year US and 2-year Canadian bond yields, which reflects the flow of funds in a short term, shrank to 0.111% on September 24th from 0.187% on September 23rd. The September 24th yield difference has been the lowest one since July 3rd, when the spread was 0.084%.
Meanwhile, the yield on Canadian 10-year government bonds soared as high as 1.498% on September 24th, after which it closed at 1.469% to lose 2.2 basis points (0.022 percentage point) compared to September 23rd.
The yield on US 10-year government bonds climbed as high as 2.166% on September 24th, after which it slipped to 2.150% at the close to lose 0.001 percentage point on a daily basis.
The spread between 10-year US and 10-year Canadian bond yields expanded to 0.681% on September 24th from 0.660% on September 23rd. The September 24th yield difference has been the largest one since September 16th, when the spread was 0.701%.
Daily and Weekly Pivot Levels
By employing the Camarilla calculation method, the daily pivot levels for USD/CAD are presented as follows:
R1 – 1.3313
R2 – 1.3325
R3 (range resistance – green on the 1-hour chart) – 1.3337
R4 (range breakout – red on the 1-hour chart) – 1.3373
S1 – 1.3289
S2 – 1.3277
S3 (range support – green on the 1-hour chart) – 1.3265
S4 (range breakout – red on the 1-hour chart) – 1.3229
By using the traditional method of calculation, the weekly pivot levels for USD/CAD are presented as follows:
Central Pivot Point – 1.3172
R1 – 1.3338
R2 – 1.3448
R3 – 1.3614
S1 – 1.3062
S2 – 1.2896
S3 – 1.2786