Yesterday’s trade saw USD/JPY within the range of 119.83-120.84. The pair closed at 120.23, slipping 0.48% on a daily basis and marking the second consecutive trading day of decline. The daily low has been the lowest level since September 9th, when the cross registered a low of 119.78.
At 8:02 GMT today USD/JPY was losing 0.59% for the day to trade at 119.53. The pair overcame the lower range breakout level (S4), as it touched a daily low at 119.50 at 8:01 GMT. It has been the lowest level since September 8th, when a daily low of 118.83 was reached.
Today the cross may be influenced by a number of macroeconomic reports as listed below.
Fundamentals
United States
Retail sales
Retail sales in the United States probably rose 0.4% in August on a monthly basis, according to the median forecast by experts. In July sales were up another 0.6%, while the June performance was revised up to flat from a 0.3% decrease previously.
Among the 13 major categories, 10 registered increases, while 1 showed no change. Sales at online stores marked the largest monthly increase in July (up 1.5%), followed by sales of motor vehicles (up 1.4%), sales at sporting goods, hobby, music and books stores (up 0.9%), sales at furniture stores (up 0.8%), sales of building materials and garden equipment (up 0.7%) and sales at food services & drinking places (up 0.7%). On the other hand, sales in general merchandise stores were 0.5% lower in July, while sales at electronics & appliance stores dropped 1.2%, according to the report by the US Census Bureau.
Annualized retail sales surged 2.4% in July, or at the fastest rate since January 2015, following a 1.4% climb in June.
US core retail sales, or retail sales ex autos, probably went up 0.3% in August compared to a month ago. If so, this would be the most modest monthly rate of increase since April 2015. In July core sales rose 0.4%. This indicator removes large ticket prices and historical seasonality of automobile sales.
The report on retail sales reflects the dollar value of merchandise sold within the retail trade by taking a sampling of companies, operating in the sector of selling physical end products to consumers. The retail sales report encompasses both fixed point-of-sale businesses and non-store retailers, such as mail catalogs and vending machines. The Census Bureau, which is a part of the Department of Commerce, surveys about 5 000 companies of all sizes, from huge retailers such as Wal-Mart to independent small family firms.
The retail sales index is considered as a coincident indicator, thus, it reflects the current state of the economy. It is also considered a pre-inflationary indicator, which investors can use in order to reassess the probability of an interest rate hike or cut by the Federal Reserve Bank. In addition, this indicator provides key information regarding consumer spending trends. Consumer expenditures, on the other hand, account for almost two-thirds of the US Gross Domestic Product. Therefore, a larger-than-expected rate of increase in sales would have a strong bullish effect on the US dollar. The official report is due out at 12:30 GMT.
Industrial Production, Capacity Utilization
Industrial output in the United States probably shrank for the first time in three months in August, down at a monthly rate of 0.2%, according to market expectations. In July industrial production grew 0.6%, or at the sharpest monthly pace since November 2014, when the index surged 1.3%. Manufacturing production, which accounts for almost three quarters of total industrial production, expanded 0.8% in July, or at the fastest monthly rate since November last year. The index for mining went up 0.2% in July, after a 0.7% climb in June. The output of utilities slumped 1.0% in July, following a 2.3% increase in the prior month.
The index of industrial production reflects the change in overall inflation-adjusted value of output in the three major sectors mentioned above. The index is sensitive to consumer demand and interest rates. As such, industrial production is an important tool for future GDP and economic performance forecasts. Those figures are also used to measure inflation by central banks as very high levels of industrial production may lead to uncontrolled levels of consumption and rapid inflation. It is a coincident indicator, which means that changes in its levels generally echo similar shifts in overall economic activity. On the other hand, a larger-than-projected monthly decline in the index would usually have a moderate bearish effect on the US dollar.
The Board of Governors of the Federal Reserve is to release the production data at 13:15 GMT.
In addition, Capacity Utilization rate in the country probably decreased to 77.8% in August from 78.0% in July. If so, this would be the lowest utilization rate since July 2013, when a rate of 77.6% was reported. This indicator represents the optimal rate for a stable production process, or the highest possible level of production in an enterprise, in case it operates within a realistic work schedule and has sufficient raw materials and inventories at its disposal. High rates of capacity utilization usually lead to inflationary pressure. In general, lower-than-anticipated rates tend to have a limited bearish effect on the US dollar.
Bond Yield Spread
The yield on Japanese 2-year government bonds went as high as 0.018% on September 14th, after which it slid to 0.015% at the close to lose 0.004 percentage point compared to September 11th.
The yield on US 2-year government bonds climbed as high as 0.734% on September 14th, after which it fell to 0.730% at the close to add 2.1 basis points (0.021 percentage point) for the day. It has been the first gain in the past three trading days.
The spread between 2-year US and 2-year Japanese bond yields, which reflects the flow of funds in a short term, widened to 0.715% on September 14th from 0.690% on September 11th. The September 14th yield difference has been the most notable one since September 10th, when the spread was 0.722%.
Meanwhile, the yield on Japans 10-year government bonds soared as high as 0.366% on September 14th, after which it slid to 0.351% at the close to lose 0.003 percentage point compared to September 11th, while marking a second straight trading day of decline.
The yield on US 10-year government bonds climbed as high as 2.203% on September 14th, after which it slipped to 2.187% at the close to remain unchanged compared to September 11th.
The spread between 10-year US and 10-year Japanese bond yields widened to 1.836% on September 14th from 1.833% on September 11th. The September 14th yield difference has been the largest one since September 10th, when the spread was 1.860%.
Daily and Weekly Pivot Levels
By employing the Camarilla calculation method, the daily pivot levels for USD/JPY are presented as follows:
R1 – 120.32
R2 – 120.42
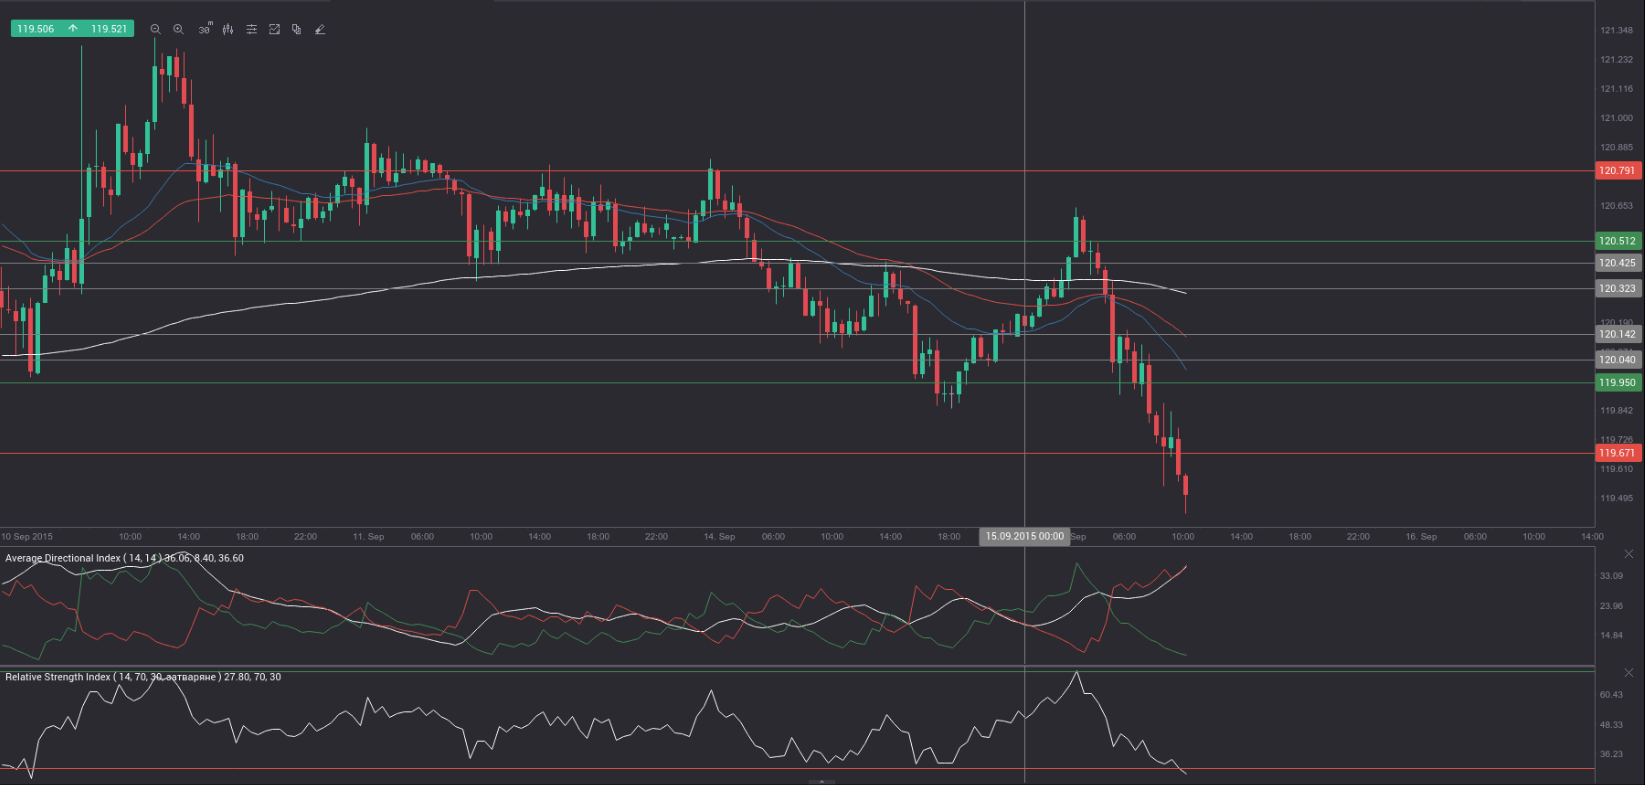
R3 (range resistance – green on the 30-minute chart) – 120.51
R4 (range breakout – red on the 30-minute chart) – 120.79
S1 – 120.14
S2 – 120.04
S3 (range support – green on the 30-minute chart) – 119.95
S4 (range breakout – red on the 30-minute chart) – 119.67
By using the traditional method of calculation, the weekly pivot levels for USD/JPY are presented as follows:
Central Pivot Point – 120.19
R1 – 121.74
R2 – 122.89
R3 – 124.44
S1 – 119.04
S2 – 117.49
S3 – 116.34