Friday’s trade saw EUR/USD within the range of 1.1253-1.1349. The pair closed at 1.1340, soaring 0.53% on a daily basis and marking a sixth consecutive trading day of gains. The daily high has also been the highest level since August 27th, when the cross registered a high of 1.1366. On a weekly basis, EUR/USD appreciated 1.73%, following two straight weeks of losses.
At 7:15 GMT today EUR/USD was up 0.20% for the day to trade at 1.1361. The pair overshot the range resistance level (R3), as it touched a daily high at 1.1373 at 7:05 GMT.
Today the cross may be influenced by a number of macroeconomic reports as listed below.
Fundamentals
Euro area
Italian consumer inflation – final estimate
Italys final annualized consumer inflation probably matched the preliminary inflation estimate of 0.2% in August, which was reported on August 31st. If so, this would be the third consecutive month, when annual inflation remained at that level. According to provisional data, in August upward pressure came from categories such as food and non alcoholic beverages (up 0.9% year-on-year), restaurants and hotels (up 1.4%), miscellaneous goods and services (up 0.2%), health (up 0.6%), recreation and culture (up 0.9%), furniture and household equipment (up 0.3%) and clothing and footwear (up 0.5%). On the other hand, downward pressure came from categories such as transportation, housing and utilities, and communication, as costs dropped 2.9%, 0.3% and 0.5%, respectively.
Key categories, included in Italys Consumer Price Index, are food and non-alcoholic beverages (accounting for 16% of total weight), transport (15%), restaurants and hotels (11%) and housing, water, electricity and other fuels (10%). Other categories are clothing and footwear (9%), furnishing and household equipment (8%), recreation and culture (8%) and health (also 8%). Communication, education, alcoholic beverages, tobacco and other goods and services comprise the remaining 15% of the index.
The nations final annualized CPI, evaluated in accordance with the harmonized methodology, probably increased 0.5% in August, according to market expectations. If so, this would match the preliminary HICP estimate, reported on August 31st, and would also be the largest annual HICP gain since April 2014, when the index climbed 0.5%. In July the final annualized HICP rose at a pace of 0.3%, down from a provisional estimate pointing to a 0.4% surge. The National Institute of Statistics (Istat) is to release the official CPI report at 8:00 GMT.
Industrial Production
The seasonally adjusted index of industrial production in the Euro area probably rose 0.2% in July compared to a month ago, according to market expectations. In May and June production shrank at a rate of 0.4%. The latter has been the sharpest monthly decrease in output since August 2014, when industrial production contracted 1.4%.
Annualized output probably increased at a pace of 0.6% in July, according to the median forecast by experts. If so, this would be the eighth consecutive month, when annual output grew, but, however, it would also be the slowest rate since January. In June industrial production expanded 1.2% year-on-year, as production of non-durable consumer goods expanded 2.5%, production of capital goods went up 1.7%, production of intermediate goods was 0.2% higher and that of durable consumer goods was up 0.1%. At the same time, production of energy remained stable.
In June, the highest increases in industrial output were reported for Ireland (27.6%), Denmark (7.6%), Lithuania (6.9%) and Slovakia (6.4%), while the most considerable decreases were observed in Greece (-4.6%), Estonia (-3.4%), the Netherlands (-2.4%), Finland (-1.1%) and Italy (-0.3%).
The index, reflecting the business cycle, measures the change in overall inflation-adjusted value of output in sectors such as manufacturing, mining and utilities. In case annualized industrial output expanded more than anticipated, this would support demand for the euro, as this implies a higher probability of inflationary pressure occurring. Eurostat is to publish the official data at 9:00 GMT.
Correlation with other Majors
Taking into account the week ended on September 13th and the daily closing levels of the major currency pairs, we come to the following conclusions in regard to the strength of relationship:
EUR/USD to AUD/USD (0.9032, or very strong)
EUR/USD to GBP/USD (0.7928, or strong)
EUR/USD to USD/JPY (0.7650, or strong)
EUR/USD to NZD/USD (-0.0440, or very weak)
EUR/USD to USD/CAD (-0.1328, or weak)
EUR/USD to USD/CHF (-0.8502, or very strong)
1. During the examined period EUR/USD moved almost equally in one and the same direction with AUD/USD, while moving almost equally in the opposite direction compared to USD/CHF.
2. EUR/USD moved strongly in one and the same direction compared to GBP/USD and USD/JPY during the past week.
3. The correlation between EUR/USD and USD/CAD was insignificant.
4. EUR/USD moved almost independently compared to NZD/USD during the period in question.
Bond Yield Spread
The yield on German 2-year government bonds went as high as -0.214% on September 11th, or the highest level since September 9th (-0.213%), after which it slid to -0.221% at the close to lose 0.003 percentage point on a daily basis.
The yield on US 2-year government bonds climbed as high as 0.742% on September 11th, after which it fell to 0.709% at the close to lose 2.8 basis points (0.028 percentage point) for the day, while marking a second consecutive trading day of decrease.
The spread between 2-year US and 2-year German bond yields, which reflects the flow of funds in a short term, shrank to 0.930% on September 11th from 0.955% during the prior day. The September 11th yield difference has been the lowest one since September 3rd, when the difference was 0.928%.
Meanwhile, the yield on German 10-year government bonds soared as high as 0.694% on September 11th, after which it slid to 0.658% at the close to lose 3.5 basis points (0.035 percentage point) compared to September 10th, while marking a second straight day of decline.
The yield on US 10-year government bonds climbed as high as 2.226% on September 11th, after which it slipped to 2.187% at the close to lose 4 basis points (0.04 percentage point) on a daily basis. It has been the first drop in the past five trading days.
The spread between 10-year US and 10-year German bond yields narrowed to 1.529% on September 11th from 1.534% during the prior day. The September 11th yield difference has been the lowest one since September 9th, when the spread was 1.492%.
Daily and Weekly Pivot Levels
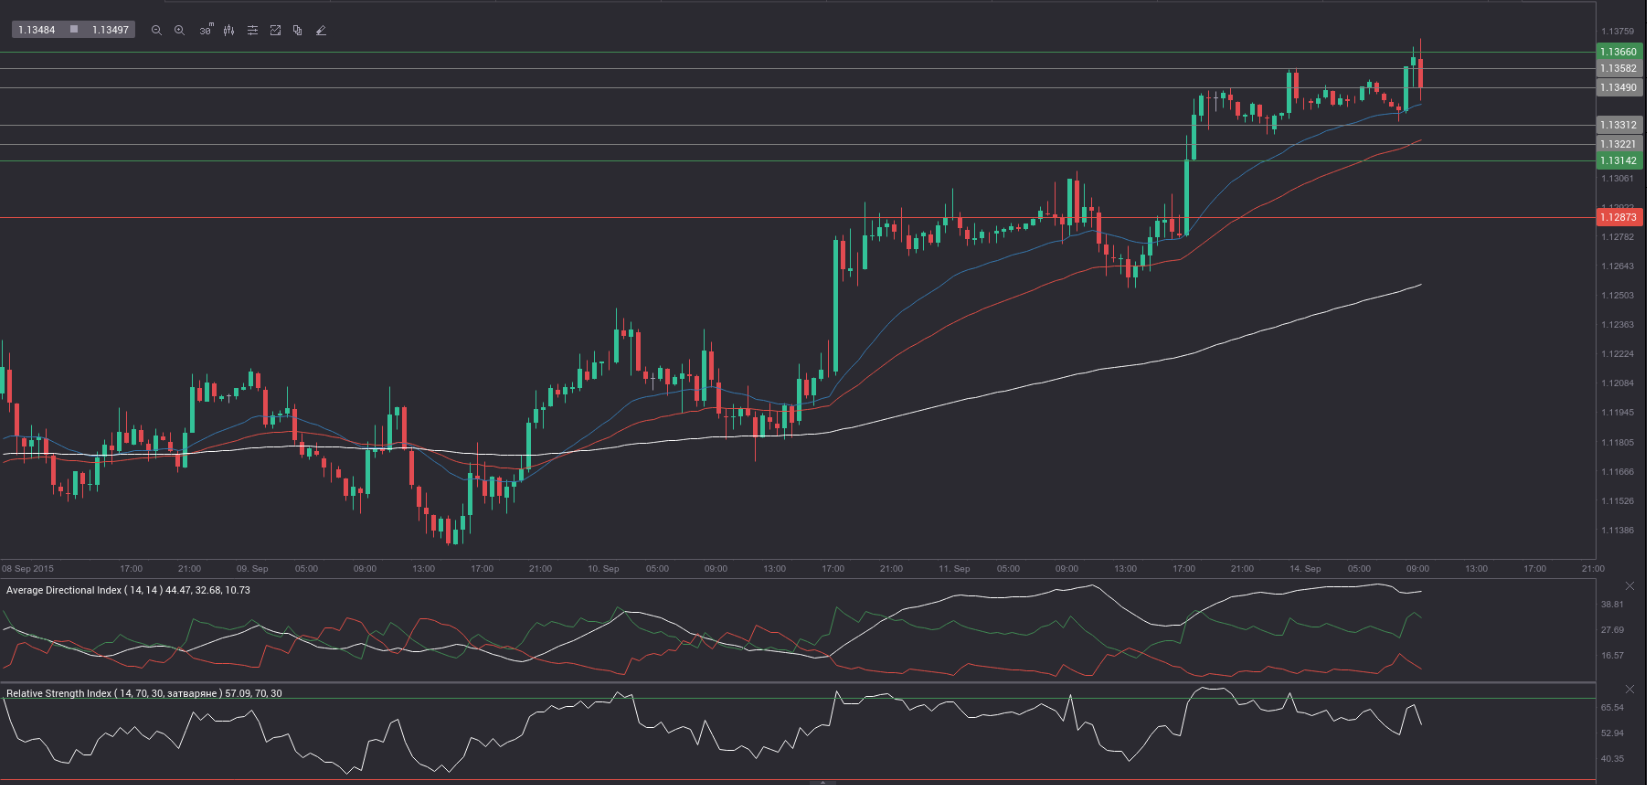
By employing the Camarilla calculation method, the daily pivot levels for EUR/USD are presented as follows:
R1 – 1.1349
R2 – 1.1358
R3 (range resistance – green on the 30-minute chart) – 1.1366
R4 (range breakout – red on the 30-minute chart) – 1.1393
S1 – 1.1331
S2 – 1.1322
S3 (range support – green on the 30-minute chart) – 1.1314
S4 (range breakout – red on the 30-minute chart) – 1.1287
By using the traditional method of calculation, the weekly pivot levels for EUR/USD are presented as follows:
Central Pivot Point – 1.1270
R1 – 1.1419
R2 – 1.1499
R3 – 1.1648
S1 – 1.1190
S2 – 1.1041
S3 – 1.0961