Yesterday’s trade saw USD/JPY within the range of 118.65-119.58. The pair closed at 119.28, rising 0.11% on a daily basis and marking the first gain in the past three trading days. The daily low has also been the lowest level since August 26th, when the cross registered a low of 118.43.
At 7:57 GMT today USD/JPY was up 0.70% for the day to trade at 120.10. The pair overcame the upper range breakout level (R4), as it touched a daily high at 120.22 at 7:46 GMT. It has been the highest level since September 3rd, when a daily high of 120.70 was recorded.
Today the cross may be influenced by a number of macroeconomic reports as listed below.
Fundamentals
United States
Consumer Credit
The money amounts, borrowed by consumers decreased to USD 18.00 billion in July, according to market expectations, from USD 20.74 billion in June. The latter has been the largest amount borrowed since July 2014, when a figure of USD 21.61 billion was reported. Given the current state of the economy, a higher-than-expected amount borrowed is usually considered as dollar positive, as it implies a potential increase in consumer spending and accelerated growth, respectively. The Board of Governors of the Federal Reserve is to release the official numbers at 19:00 GMT.
Bond Yield Spread
The yield on Japanese 2-year government bonds went as high as 0.019% on September 7th, or the highest level since September 3rd (0.019%), after which it slid to 0.015% at the close to remain unchanged compared to September 4th.
The yield on US 2-year government bonds climbed as high as 0.717% on September 7th, after which it closed at the exact same level to add 0.008 percentage point for the day.
The spread between 2-year US and 2-year Japanese bond yields, which reflects the flow of funds in a short term, expanded to 0.702% on September 7th from 0.694% on September 4th. The September 7th yield spread has been the most notable one since August 31st, when the difference was 0.728%.
Meanwhile, the yield on Japans 10-year government bonds soared as high as 0.374 on September 7th, after which it slid to 0.369% at the close to lose 0.005 percentage point compared to September 4th. It has been a second consecutive trading day of decrease.
The yield on US 10-year government bonds climbed as high as 2.151% on September 7th, after which it closed at the exact same level to add 2 basis points (0.02 percentage point) compared to September 4th. It has been the first gain in the past three trading days.
The spread between 10-year US and 10-year Japanese bond yields expanded to 1.782% on September 7th from 1.757% on September 4th. The September 7th yield difference has been the largest one since September 2nd, when the spread was 1.792%.
Daily and Weekly Pivot Levels
By employing the Camarilla calculation method, the daily pivot levels for USD/JPY are presented as follows:
R1 – 119.37
R2 – 119.45
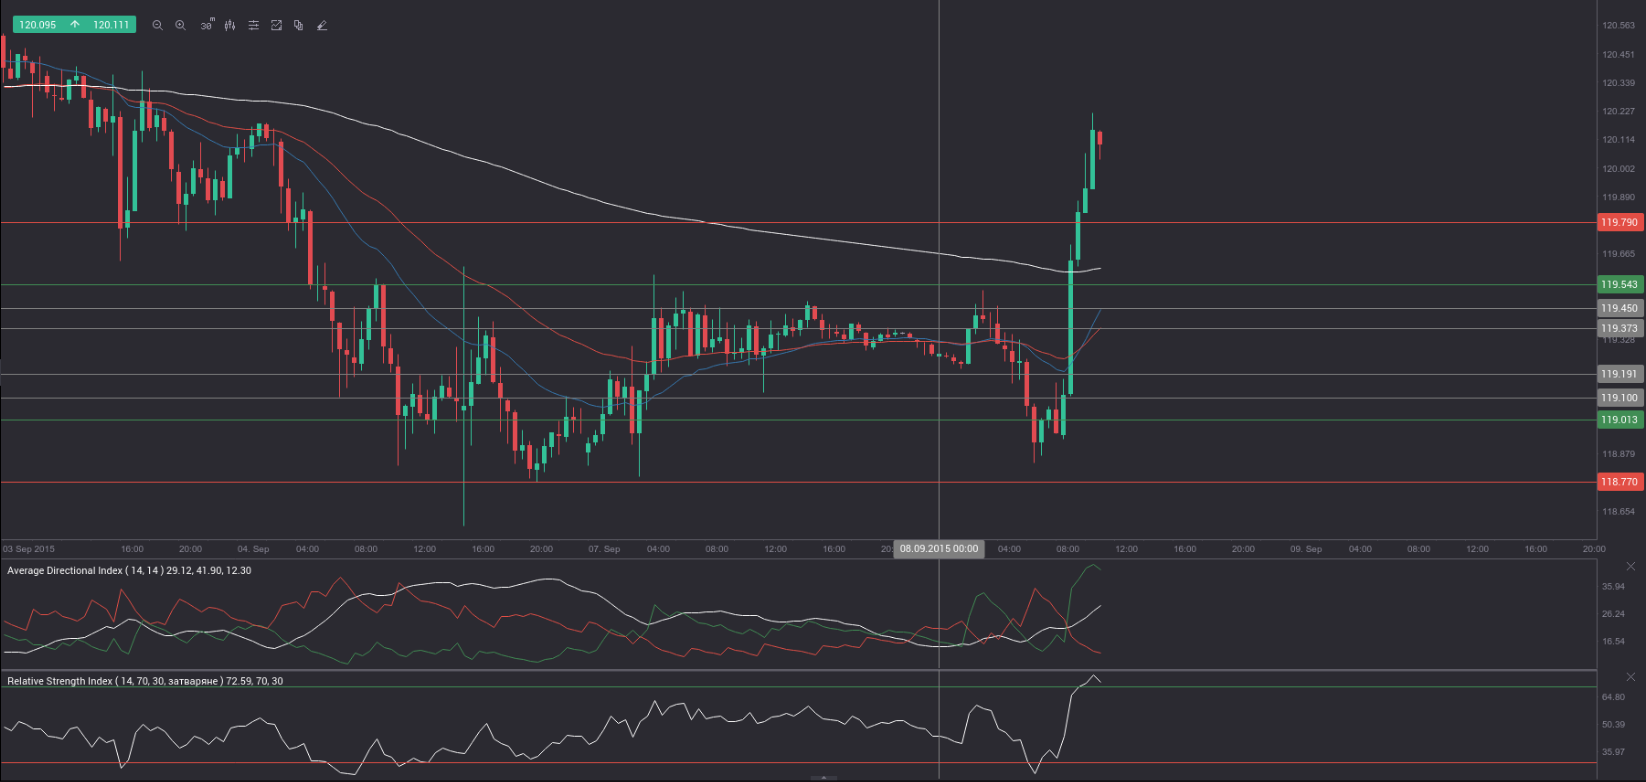
R3 (range resistance – green on the 30-minute chart) – 119.54
R4 (range breakout – red on the 30-minute chart) – 119.79
S1 – 119.19
S2 – 119.10
S3 (range support – green on the 30-minute chart) – 119.01
S4 (range breakout – red on the 30-minute chart) – 118.77
By using the traditional method of calculation, the weekly pivot levels for USD/JPY are presented as follows:
Central Pivot Point – 119.83
R1 – 120.92
R2 – 122.83
R3 – 123.92
S1 – 117.92
S2 – 116.83
S3 – 114.92