Yesterday’s trade saw USD/CAD within the range of 1.3242-1.3310. The pair closed at 1.3307, rising 0.23% on a daily basis and extending gains from Friday. The daily high has been the highest level since September 2nd, when a high of 1.3326 was reached.
According to Binary Tribune’s analysis on historical volatility, the average intraday volatility for the pair was 0.985% in August, or the highest since April, when average volatility was estimated at 1.062%. Within the period January 2013-August 2015, the highest average intraday volatility was seen in February 2015 (1.205%). At the same time, the average daily volatility for USD/CAD was 1.043% in August, or almost the same as in July (1.049%). Within the period January 2013-August 2015, the highest average daily volatility was observed in January 2015 (1.431%).
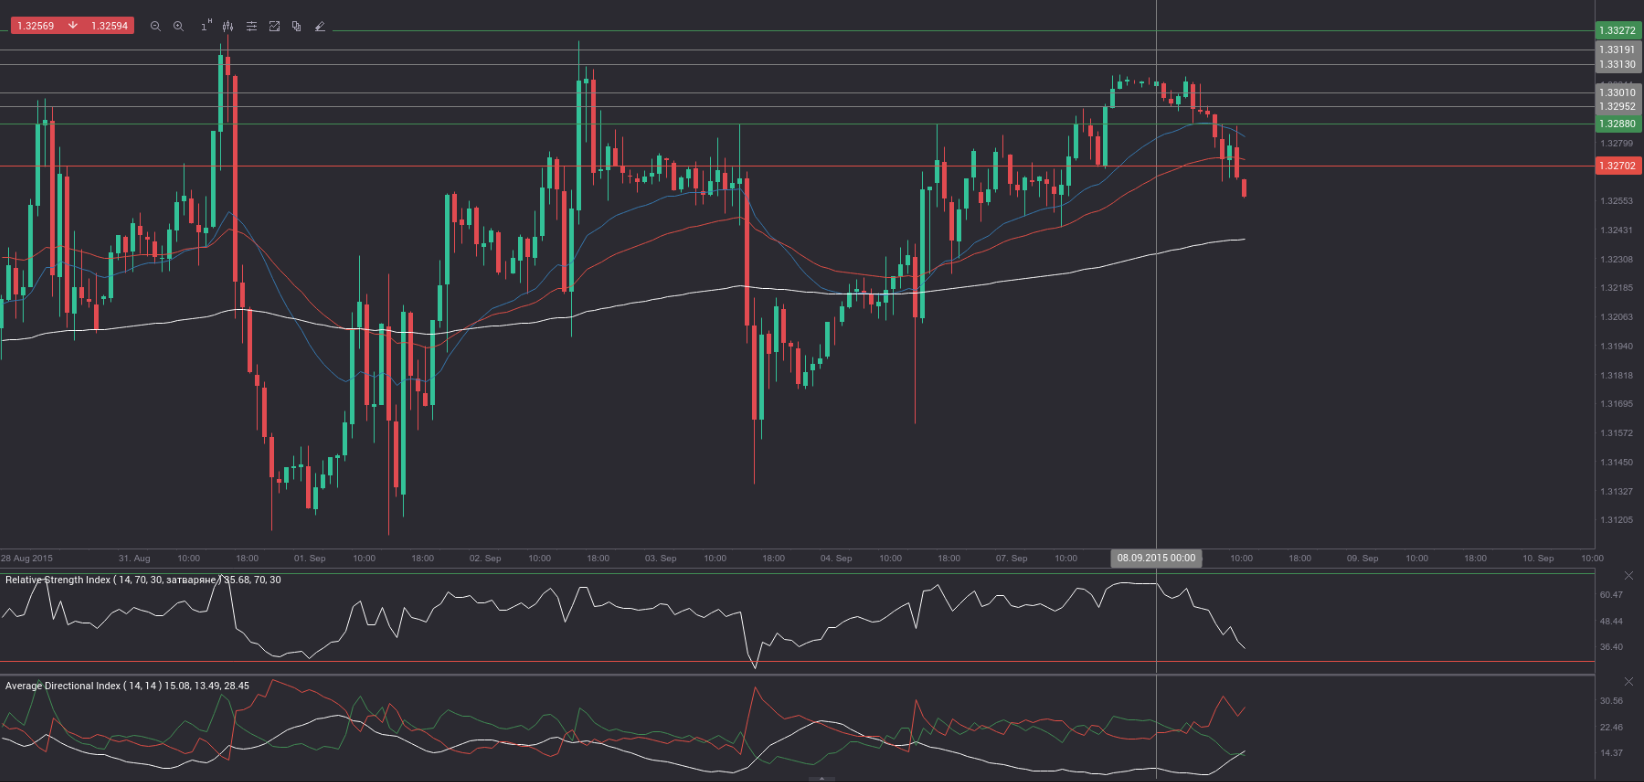
At 8:50 GMT today USD/CAD was down 0.30% for the day to trade at 1.3268. The pair overcame the lower range breakout level (S4), as it touched a daily low at 1.3265 at 6:45 GMT.
Fundamentals
United States
Consumer Credit
The money amounts, borrowed by consumers decreased to USD 18.00 billion in July, according to market expectations, from USD 20.74 billion in June. The latter has been the largest amount borrowed since July 2014, when a figure of USD 21.61 billion was reported. Given the current state of the economy, a higher-than-expected amount borrowed is usually considered as dollar positive, as it implies a potential increase in consumer spending and accelerated growth, respectively. The Board of Governors of the Federal Reserve is to release the official numbers at 19:00 GMT.
Bond Yields
The yield on US 2-year government bonds climbed as high as 0.717% on September 7th, after which it closed at the exact same level to add 0.008 percentage point for the day.
At the same time, the yield on US 10-year government bonds climbed as high as 2.151% on September 7th, after which it closed at the exact same level to add 2 basis points (0.02 percentage point) compared to September 4th. It has been the first gain in the past three trading days.
Bond market in Canada was closed on Monday.
Daily and Weekly Pivot Levels
By employing the Camarilla calculation method, the daily pivot levels for USD/CAD are presented as follows:
R1 – 1.3313
R2 – 1.3319
R3 (range resistance – green on the 1-hour chart) – 1.3327
R4 (range breakout – red on the 1-hour chart) – 1.3344
S1 – 1.3301
S2 – 1.3295
S3 (range support – green on the 1-hour chart) – 1.3288
S4 (range breakout – red on the 1-hour chart) – 1.3270
By using the traditional method of calculation, the weekly pivot levels for USD/CAD are presented as follows:
Central Pivot Point – 1.3242
R1 – 1.3371
R2 – 1.3458
R3 – 1.3587
S1 – 1.3155
S2 – 1.3026
S3 – 1.2939