Friday’s trade saw USD/CAD within the range of 1.3159-1.3291. The pair closed at 1.3284, rising 0.84% on a daily basis, which has been the most considerable rate of increase since September 1st, when it appreciated 0.94%.
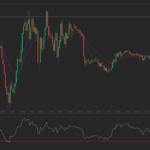
At 9:55 GMT today USD/CAD was down 0.02% for the day to trade at 1.3280. The pair tested the range support level (S3), as it touched a daily low at 1.3245 at 8:10 GMT.
Markets in the United States and Canada are to remain closed today for national holidays.
Correlation with other Major pairs
Taking into account the week ended on September 6th and the daily closing levels of the major currency pairs, we come to the following conclusions in regard to the strength of relationship:
USD/CAD to EUR/USD (0.2312, or weak)
USD/CAD to USD/CHF (-0.1697, or weak)
USD/CAD to GBP/USD (-0.5447, or strong)
USD/CAD to NZD/USD (-0.5681, or strong)
USD/CAD to AUD/USD (-0.7400, or strong)
USD/CAD to USD/JPY (-0.8029, or very strong)
1. During the examined period USD/CAD moved almost equally in the opposite direction in comparison with USD/JPY.
2. USD/CAD moved strongly in the opposite direction compared with GBP/USD, NZD/USD and AUD/USD during the past week.
3. The correlation between USD/CAD and EUR/USD, USD/CAD and USD/CHF was insignificant during the period in question.
Bond Yield Spread
The yield on Canadian 2-year government bonds went as high as 0.459% on September 4th, or the highest level since August 10th (0.466%), after which it slid to 0.441% at the close to add 0.007 percentage point on a daily basis. It has been a third consecutive trading day of increase.
The yield on US 2-year government bonds climbed as high as 0.733% on September 4th, or the highest level since September 1st (0.735%), after which it fell to 0.709% at the close to add 1.3 basis points (0.013 percentage point) for the day. It has been the first gain in the past four trading days.
The spread between 2-year US and 2-year Canadian bond yields, which reflects the flow of funds in a short term, widened to 0.268% on September 4th from 0.262% on September 3rd. The September 4th yield spread has been the largest one since September 2nd, when the difference was 0.292%.
Meanwhile, the yield on Canadian 10-year government bonds soared as high as 1.494% on September 4th, or the highest level since August 6th, after which it closed at 1.439% to lose 2.4 basis points (0.024 percentage point) compared to September 3rd. It has been the first drop in the past three trading days.
The yield on US 10-year government bonds climbed as high as 2.169% on September 4th, after which it slipped to 2.131% at the close to lose 3.2 basis points (0.032 percentage point) on a daily basis, while marking a second consecutive trading day of decrease.
The spread between 10-year US and 10-year Canadian bond yields narrowed to 0.692% on September 4th from 0.700% on September 3rd. The September 4th yield difference has been the lowest one since July 8th, when the spread was 0.680%.
Daily and Weekly Pivot Levels
By employing the Camarilla calculation method, the daily pivot levels for USD/CAD are presented as follows:
R1 – 1.3296
R2 – 1.3308
R3 (range resistance – green on the 1-hour chart) – 1.3320
R4 (range breakout – red on the 1-hour chart) – 1.3357
S1 – 1.3272
S2 – 1.3260
S3 (range support – green on the 1-hour chart) – 1.3248
S4 (range breakout – red on the 1-hour chart) – 1.3211
By using the traditional method of calculation, the weekly pivot levels for USD/CAD are presented as follows:
Central Pivot Point – 1.3242
R1 – 1.3371
R2 – 1.3458
R3 – 1.3587
S1 – 1.3155
S2 – 1.3026
S3 – 1.2939