Yesterday’s trade saw USD/CAD within the range of 1.3133-1.3290. The pair closed at 1.3176, losing 0.68% on a daily basis and marking the first drop in the past three trading days.
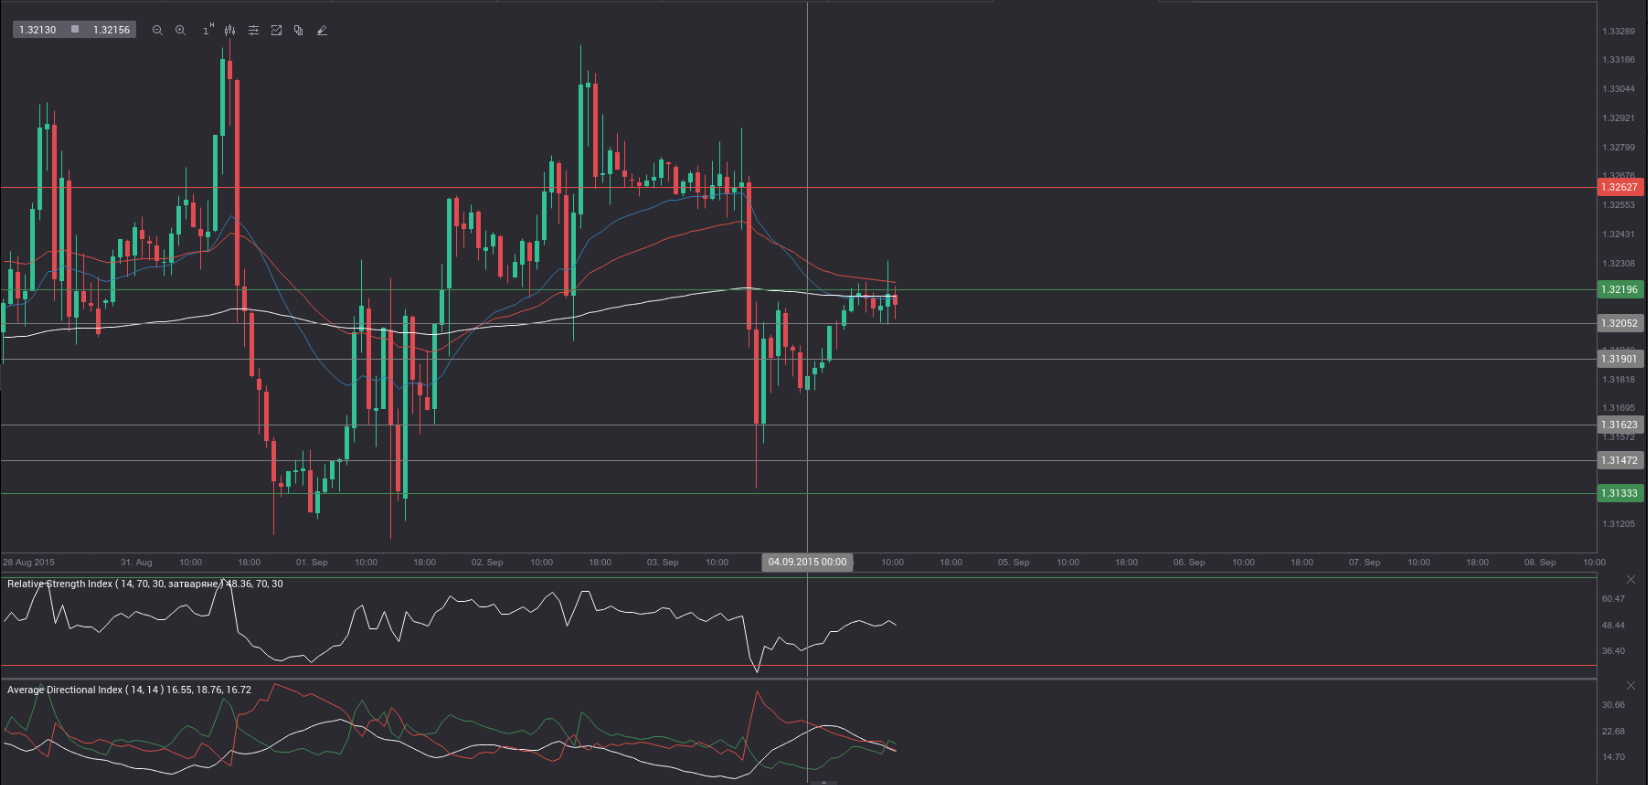
At 9:30 GMT today USD/CAD was gaining 0.24% for the day to trade at 1.3211. The pair overshot the range resistance level (R3), as it touched a daily high at 1.3234 at 8:20 GMT.
Today the cross may be influenced by a number of macroeconomic reports as listed below.
Fundamentals
United States
Non-farm payrolls, Unemployment rate
Employers in all sectors of economy in the United States, excluding the farming industry, probably added 220 000 new jobs in August, according to the median forecast by experts, after a job gain of 215 000 in July. If so, this would be the fifth consecutive month, when employment gains exceeded 200 000.
Employment in retail trade rose by 36 000 in July. Health care employment increased by 28 000, while employment in financial services rose by 17 000. Manufacturing employment increased by 15 000, while the sector of transportation and warehousing added 14 000 jobs, according to the report by the Bureau of Labor Statistics (BLS).
The non-farm payrolls report presents the total number of US employees in any business, excluding the following four groups: farm employees, general government employees, employees of non-profit organizations, private household employees. The reading, released most often, varies between 10 000 and as much as 250 000 – 300 000 at times when economy is performing well. Despite the volatility and the possibility of large revisions, the non-farm payrolls indicator presents the most timely and comprehensive reflection of the current economic state. Total non-farm payrolls account for 80% of the workers, who produce the entire Gross Domestic Product of the United States. In case of a greater-than-expected gain in jobs, the US dollar would certainly see support.
Average Hourly Earnings probably increased a second month in a row in August, or 0.2%, according to the median forecast, following another 0.2% surge in July.
The rate of unemployment in the country probably dropped to 5.2% in August from 5.3% in July. If so, this would be the lowest rate since April 2008, when unemployment was registered at 5.0%.
In case the unemployment rate met expectations or even fell further, this would have a bullish effect on the greenback, because of the positive implications for consumer spending. The Bureau of Labor Statistics will release the official employment data at 12:30 GMT.
Canada
Change in employment
The number of the employed people in Canada probably decreased by 4 500 in August, according to market expectations. In July the number of the employed rose by 6 600. Compared with July 2014, Canadian employment increased 0.9%, or by 161 000, due to a larger number of full-time job positions. In July employment among men aged between 25 and 54 rose by 19 000, while there was a slight change among the other demographic groups. Employment increased in sectors such as professional, scientific and technical services as well as public administration, according to the report by the Statistics Canada. Creation of new job positions is a key indicator, providing clues over potential consumer spending. In case employment in the country decreased at a faster pace than expected, this would have a strong bearish effect on the Canadian dollar.
Meanwhile, the rate of unemployment in the country probably remained steady at 6.8% for a seventh consecutive month in August. In July youth unemployment rate increased to 13.2% from 12.9% in June. A higher-than-expected rate of unemployment would have a strong bearish effect on the loonie. Statistics Canada is expected to release its official employment report at 12:30 GMT.
Ivey PMI
Activity among purchasing managers in Canada probably slowed down for a third consecutive month in August, with the corresponding seasonally adjusted PMI coming in at a value of 52.0. If so, however, this would be the fifth straight month of activity expansion. In July the gauge stood at 52.9. This indicator is based on a survey sponsored by Richard Ivey School of Business and Canadian Purchasing Management Association. It encompasses 175 respondents in both the public and the private sector, selected in accordance with their geographic location and activity, so that the entire economy is covered. Activity among purchasing managers is closely watched by market players, as managers usually have an early access to data regarding performance of their companies, which could be used as a leading indicator of overall economic activity. Readings at the key level of 50.0 are indicative of no change in business conditions. In case the PMI demonstrated a larger-than-expected slowdown, this would trim demand for the loonie. The official reading is due out at 14:00 GMT.
Bond Yield Spread
The yield on Canadian 2-year government bonds went as high as 0.455% on September 3rd, or the highest level since September 1st (0.455%), after which it slid to 0.431% at the close to add 1.1 basis points (0.011 percentage point) on a daily basis. It has been a second consecutive trading day of increase.
The yield on US 2-year government bonds climbed as high as 0.716% on September 3rd, after which it fell to 0.704% at the close to lose 0.008 percentage point for the day.
The spread between 2-year US and 2-year Canadian bond yields, which reflects the flow of funds in a short term, shrank to 0.273% on September 3rd from 0.292% on September 2nd. The September 3rd yield spread has been the lowest one since August 25th, when the difference was 0.257%.
Meanwhile, the yield on Canadian 10-year government bonds soared as high as 1.489% on September 3rd, or the highest level since August 31st, after which it closed at 1.463% to gain 0.008 percentage point compared to September 2nd.
The yield on US 10-year government bonds climbed as high as 2.197% on September 3rd, after which it slipped to 2.167% at the close to lose 2.1 basis points (0.021 percentage point) on a daily basis.
The spread between 10-year US and 10-year Canadian bond yields narrowed to 0.704% on September 3rd from 0.733% on September 2nd. The September 3rd yield difference has been the lowest one since July 8th, when the spread was 0.680%.
Daily and Weekly Pivot Levels
By employing the Camarilla calculation method, the daily pivot levels for USD/CAD are presented as follows:
R1 – 1.3190
R2 – 1.3205
R3 (range resistance – green on the 1-hour chart) – 1.3219
R4 (range breakout – red on the 1-hour chart) – 1.3262
S1 – 1.3162
S2 – 1.3147
S3 (range support – green on the 1-hour chart) – 1.3133
S4 (range breakout – red on the 1-hour chart) – 1.3090
By using the traditional method of calculation, the weekly pivot levels for USD/CAD are presented as follows:
Central Pivot Point – 1.3233
R1 – 1.3322
R2 – 1.3443
R3 – 1.3532
S1 – 1.3112
S2 – 1.3023
S3 – 1.2902