Yesterday’s trade saw EUR/USD within the range of 1.1204-1.1333. The pair closed at 1.1319, soaring 0.93% on a daily basis and marking the sharpest rate of increase since August 24th, when it appreciated 2.14%. The daily high has also been the highest level since August 27th, when the cross registered a high of 1.1366.
At 6:42 GMT today EUR/USD was losing 0.38% for the day to trade at 1.1273. The pair attempted to test the lower range breakout level (S4), as it touched a daily low at 1.1261 at 1:05 GMT.
Today the cross may be influenced by a number of macroeconomic reports as listed below.
Fundamentals
Euro area
Producer Prices
The annualized index of producer prices (PPI) probably fell 2.1% in July, according to market expectations, after a 2.2% decline in June. If so, this would be the 24th consecutive month, when annual producer prices slumped. The Producer Price Index measures changes in prices of goods and services either as they leave the production process, or as they enter it. Unlike the CPI, which measures price changes from the consumers perspective, the PPI basically gauges the prices received by domestic producers for their output, or the prices paid by domestic producers for their intermediate inputs. The PPI performance may be used as an early signal for inflationary pressure in economy. Generally speaking, a higher-than-expected PPI reading may have a limited bullish effect on the common currency, as it suggests acceleration in consumer prices, while a lower-than-expected result may have a bearish effect. Eurostat is to release the official report at 9:00 GMT.
United States
Change in employment by ADP
Employers in the US non-farm private sector probably added 201 000 new jobs during August, according to the median estimate by experts, following 185 000 new positions added in July. The latter has been the lowest gain in jobs since April, when 169 000 jobs were added. The employment report by Automated Data Processing Inc. (ADP) is based on data that encompasses 400 000 – 500 000 companies employing over 24 million people, working in the 19 major sectors of the economy. The ADP employment change indicator is calculated in accordance with the same methodology, which the Bureau of Labor Statistics (BLS) uses. Published two days ahead of the governments employment statistics, this report is used by traders as a reliable predictor of the official non-farm payrolls data. Creation of jobs has a direct link to consumer spending, while the latter is a major driving force behind economic growth. In case new jobs growth came above expectations, this would bolster demand for the US dollar. The official figure is scheduled to be published at 12:15 GMT.
Factory Orders
Factory orders in the United States probably rose 0.9% in July compared to June, following a surge by 1.8% in the prior month. The latter has been the sharpest monthly rate of increase since March, when factory orders climbed 2.1%. Excluding the sector of transportation, factory orders rose 0.5% in June. This indicator presents the total value of new purchase orders, placed at manufacturers for durable and non-durable goods, and can provide insight into inflation and growth in the US sector of manufacturing. In case new orders rose at a faster-than-anticipated rate, this would have a moderate bullish effect on the US dollar, as it implies future growth acceleration. The US Census Bureau will release the official data at 14:00 GMT.
Beige Book
At 18:00 GMT the Federal Reserve is to release its “Beige Book” report. It is published eight times during the year. Each of the banks in the 12 Federal Reserve Districts gathers data in regard to current economic situation in the country on the basis of interviews with key business contacts, economists, market experts, and other sources. In case the Beige Book presents an optimistic economic outlook, this will usually support the greenback, while a pessimistic view will have a bearish effect on the currency.
Bond Yield Spread
The yield on German 2-year government bonds went as high as -0.186% on September 1st, or the highest level since June 26th (-0.183%), after which it slid to -0.206% at the close to lose 1.2 basis points (0.012 percentage point) on a daily basis. It has been the first drop in the past six trading days.
The yield on US 2-year government bonds climbed as high as 0.735% on September 1st, after which it fell to 0.708% at the close to lose 3.2 basis points (0.032 percentage point) for the day. It has been the first decrease in six trading days.
The spread between 2-year US and 2-year German bond yields, which reflects the flow of funds in a short term, shrank to 0.914% on September 1st from 0.933% during the prior day. The September 1st yield spread has been the lowest one since August 26th, when the difference was 0.899%.
Meanwhile, the yield on German 10-year government bonds soared as high as 0.822% on September 1st, or the highest level since July 16th (0.824%), after which it slid to 0.803% at the close to appreciate 0.008 percentage point compared to August 31st, while marking a second straight day of gains.
The yield on US 10-year government bonds climbed as high as 2.214% on September 1st, after which it slipped to 2.159% at the close to lose 5.5 basis points (0.055 percentage point) on a daily basis.
The spread between 10-year US and 10-year German bond yields narrowed to 1.356% on September 1st from 1.419% on August 31st. The September 1st yield difference has been the lowest one since August 25th, when the spread was 1.325%.
Daily and Weekly Pivot Levels
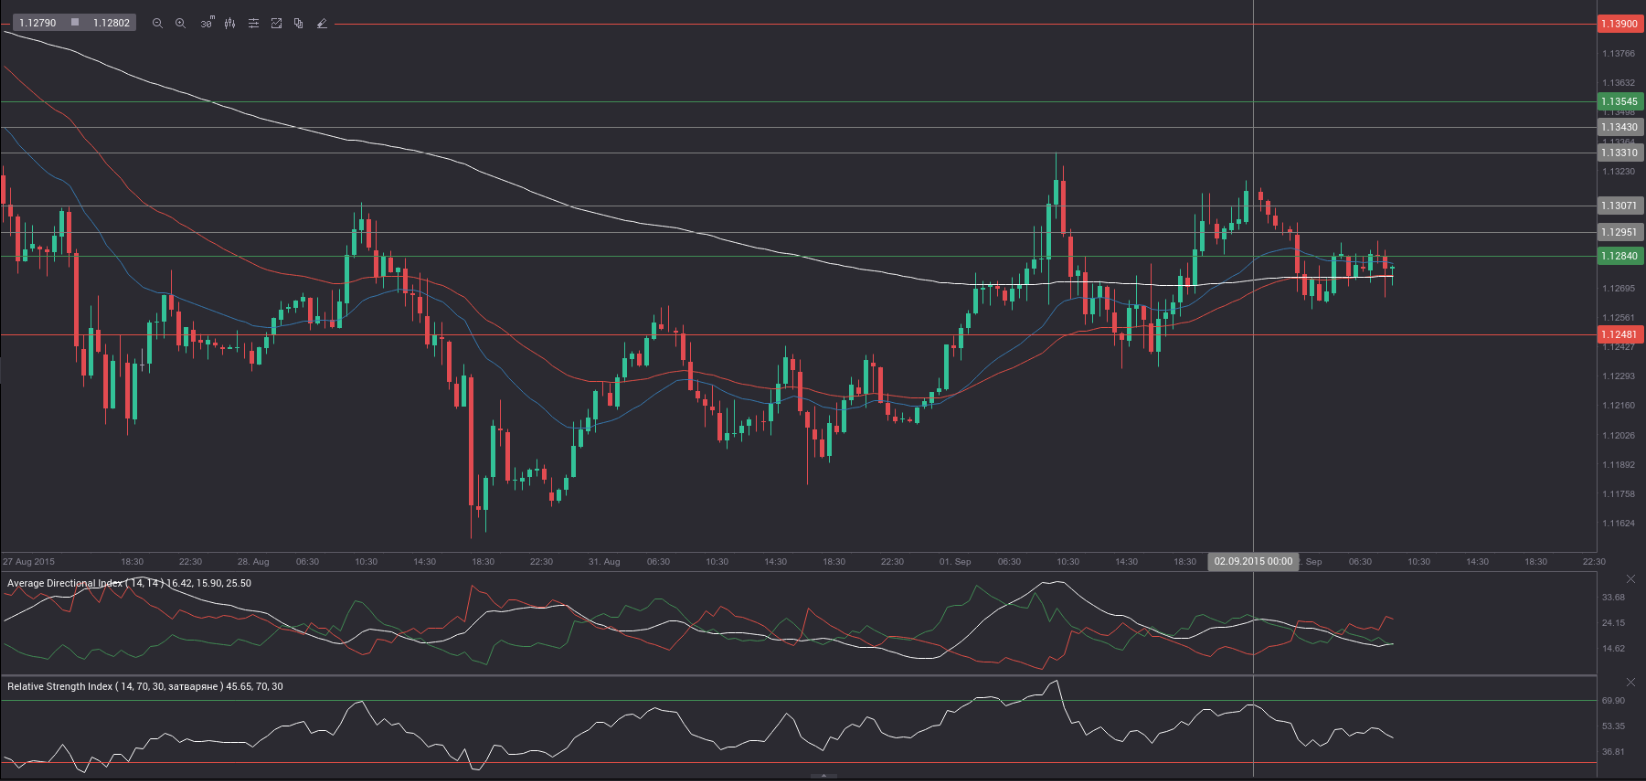
By employing the Camarilla calculation method, the daily pivot levels for EUR/USD are presented as follows:
R1 – 1.1331
R2 – 1.1343
R3 (range resistance – green on the 30-minute chart) – 1.1354
R4 (range breakout – red on the 30-minute chart) – 1.1390
S1 – 1.1307
S2 – 1.1295
S3 (range support – green on the 30-minute chart) – 1.1284
S4 (range breakout – red on the 30-minute chart) – 1.1248
By using the traditional method of calculation, the weekly pivot levels for EUR/USD are presented as follows:
Central Pivot Point – 1.1348
R1 – 1.1542
R2 – 1.1904
R3 – 1.2098
S1 – 1.0986
S2 – 1.0792
S3 – 1.0430