Friday’s trade saw EUR/USD within the range of 1.1155-1.1309. The pair closed at 1.1179, falling 0.59% on a daily basis and marking the fourth consecutive trading day of losses. The daily low has been the lowest level since August 20th, when the cross registered a low of 1.1105.
At 6:44 GMT today EUR/USD was up 0.46% for the day to trade at 1.1239. The pair tested the upper range breakout level (R4), as it touched a daily high at 1.1262 at 5:10 GMT.
Today the cross may be influenced by a number of macroeconomic reports as listed below.
Fundamentals
Euro area
Italian retail sales
At 8:00 GMT the National Institute of Statistics (Istat) is to report on retail sales regarding June. In May annualized retail sales rose 0.3%, after remaining flat in April. In monthly terms, retail sales with a seasonal adjustment dropped 0.1% in May, following a 0.7% surge in April. The latter has been the sharpest monthly increase since February 2012, when sales climbed 0.9%. This indicator reflects the change in the total value of inflation-adjusted sales by retailers in the country and provides key information regarding the consumer spending trend, while the latter is a key driving force behind economic growth. An increase in the monthly retail sales index usually has a limited bullish effect on the euro and vice versa.
Italian consumer inflation – preliminary estimate
Italys preliminary annualized consumer inflation probably ticked down to 0.1% in August, according to expectations, from a final rate of 0.2% in July, as reported on August 11th. If so, it would be the lowest annual inflation rate since May, when a level of 0.1% was reported.
In July the largest downward pressures, causing an impact on annual inflation rate, were reported for communication (down 3.2% year-on-year) and transportation (down 1.8%). The largest upward pressures during the month came from alcoholic beverages and tobacco (up 3% year-on-year), education (up 1.9%), accommodation (up 1.4%), recreation and culture (up 1.2%), food (up 0.8%), healthcare (up 0.6%), furniture, and household services (up 0.4%) and clothing and footwear (up 0.4%).
Key categories, included in Italys Consumer Price Index, are food and non-alcoholic beverages (accounting for 16% of total weight), transport (15%), restaurants and hotels (11%) and housing, water, electricity and other fuels (10%). Other categories are clothing and footwear (9%), furnishing and household equipment (8%), recreation and culture (8%) and health (also 8%). Communication, education, alcoholic beverages, tobacco and other goods and services comprise the remaining 15% of the index.
The nations preliminary annualized CPI, evaluated in accordance with the harmonized methodology, probably rose 0.3% in August, according to market expectations. If so, it would match the annual rate of increase in July, according to final data. The latter has been the highest annual core inflation since November 2014, when a rate of 0.3% was reported. A slowdown in the general CPI would have a limited bearish effect on the single currency. The National Institute of Statistics (Istat) is to release the official CPI report at 9:00 GMT.
Euro area consumer inflation – preliminary estimate
The preliminary annualized consumer inflation in the Euro zone, evaluated in accordance with Eurostat’s harmonized methodology, probably decelerated to 0.1% in August, according to the median estimate by experts, from a final rate of 0.2% in July. If so, this would be the lowest annual inflation since April, when a zero rate was reported.
The largest upward pressures to impact the regions annual inflation in July were recorded for restaurants & cafés (0.09 percentage point), tobacco (0.08 percentage point) and rents (0.06 percentage point).
At the same time, the largest downward pressure came from categories such as fuels for transport (-0.43 percentage point), heating oil (-0.20 percentage point) and milk, cheese & eggs (-0.06 percentage point), according to the report by Eurostat.
The index shows the change in price levels of a basket of goods and services from consumer’s perspective and also reflects purchasing trends. The main components of the HICP are food, alcohol and tobacco (accounting for 19% of the total weight), energy (11%), non-energy industrial goods (29%) and services (41%).
The Harmonized Index of Consumer Prices (HICP) is used to evaluate and compare inflation rates between Member States, according to Art. 121 of the Amsterdam’s Agreement and directives by the European Central Bank (ECB), in order the latter to achieve price stability and the implementation of monetary policy.
In case the HICP slowed down more than anticipated, thus, further distancing from the 2% inflation objective set by the ECB, this would mount selling pressure on the euro, as this suggests the desired effect from monetary policy accommodation appears to be insufficient.
The preliminary annualized Core HICP probably increased at a rate of 1.0% in August, matching the final rate, reported in July. It has been the highest annual core inflation since April 2014, when a final rate of 1.0% was reported. This index excludes volatile categories such as food, energy, alcohol and tobacco. Eurostat is scheduled to release the preliminary inflation data at 9:00 GMT.
United States
Chicago Manufacturing Survey
The Chicago Purchasing Managers Index (PMI) probably slowed down to a reading of 54.5 in August, according to expectations, from 54.7 during the prior month. The latter has been the highest reading since January 2015, when the PMI came in at 59.4. The index reflects business conditions in the regions manufacturing sector and is interrelated with the Manufacturing Index, published by the Institute for Supply Management (ISM). A reading above the key level of 50.0 is indicative of expansion in manufacturing activity. In case the PMI lowered more than forecast, this would have a moderate bearish effect on the US dollar. The MNI Deutche Börse Group will release the official reading of the Chicago barometer at 13:45 GMT.
Correlation with other Majors
Taking into account the week ended on August 30th and the daily closing levels of the major currency pairs, we come to the following conclusions in regard to the strength of relationship:
EUR/USD to GBP/USD (0.9897, or very strong)
EUR/USD to USD/CAD (0.7839, or strong)
EUR/USD to NZD/USD (0.5228, or strong)
EUR/USD to AUD/USD (-0.3509, or moderate)
EUR/USD to USD/JPY (-0.9739, or very strong)
EUR/USD to USD/CHF (-0.9773, or very strong)
1. During the examined period EUR/USD moved almost equally in one and the same direction with GBP/USD. It was an almost perfect correlation.
2. EUR/USD moved almost equally in the opposite direction compared to USD/JPY and USD/CHF during the period.
3. EUR/USD moved strongly in one and the same direction with USD/CAD and NZD/USD in the past week.
Bond Yield Spread
The yield on German 2-year government bonds went as high as -0.205% on August 28th, or the highest level since July 20th (-0.205%), after which it closed at the same level to add 1.1 basis points (0.011 percentage point) on a daily basis. It has been the fourth straight trading day of gains.
The yield on US 2-year government bonds climbed as high as 0.735% on August 28th, or the highest level since August 19th (0.738%), after which it fell to 0.724% at the close to add 2.4 basis points (0.024 percentage point) for the day, while marking a fourth successive trading day of gains.
The spread between 2-year US and 2-year German bond yields, which reflects the flow of funds in a short term, expanded to 0.929% on August 28th from 0.916% during the prior day. The August 28th yield spread has been the most notable one since August 18th, when the difference was 0.974%.
Meanwhile, the yield on German 10-year government bonds soared as high as 0.739% on August 28th, after which it slid to 0.726% at the close to lose 1.6 basis points (0.016 percentage point) compared to August 27th.
The yield on US 10-year government bonds climbed as high as 2.197% on August 28th, after which it slipped to 2.184% at the close to lose 0.007 percentage point on a daily basis. It has been the first drop in the past four trading days.
The spread between 10-year US and 10-year German bond yields widened to 1.458% on August 28th from 1.449% during the prior day. The August 28th yield difference has been the largest one since August 26th, when the spread was 1.472%.
Daily and Weekly Pivot Levels
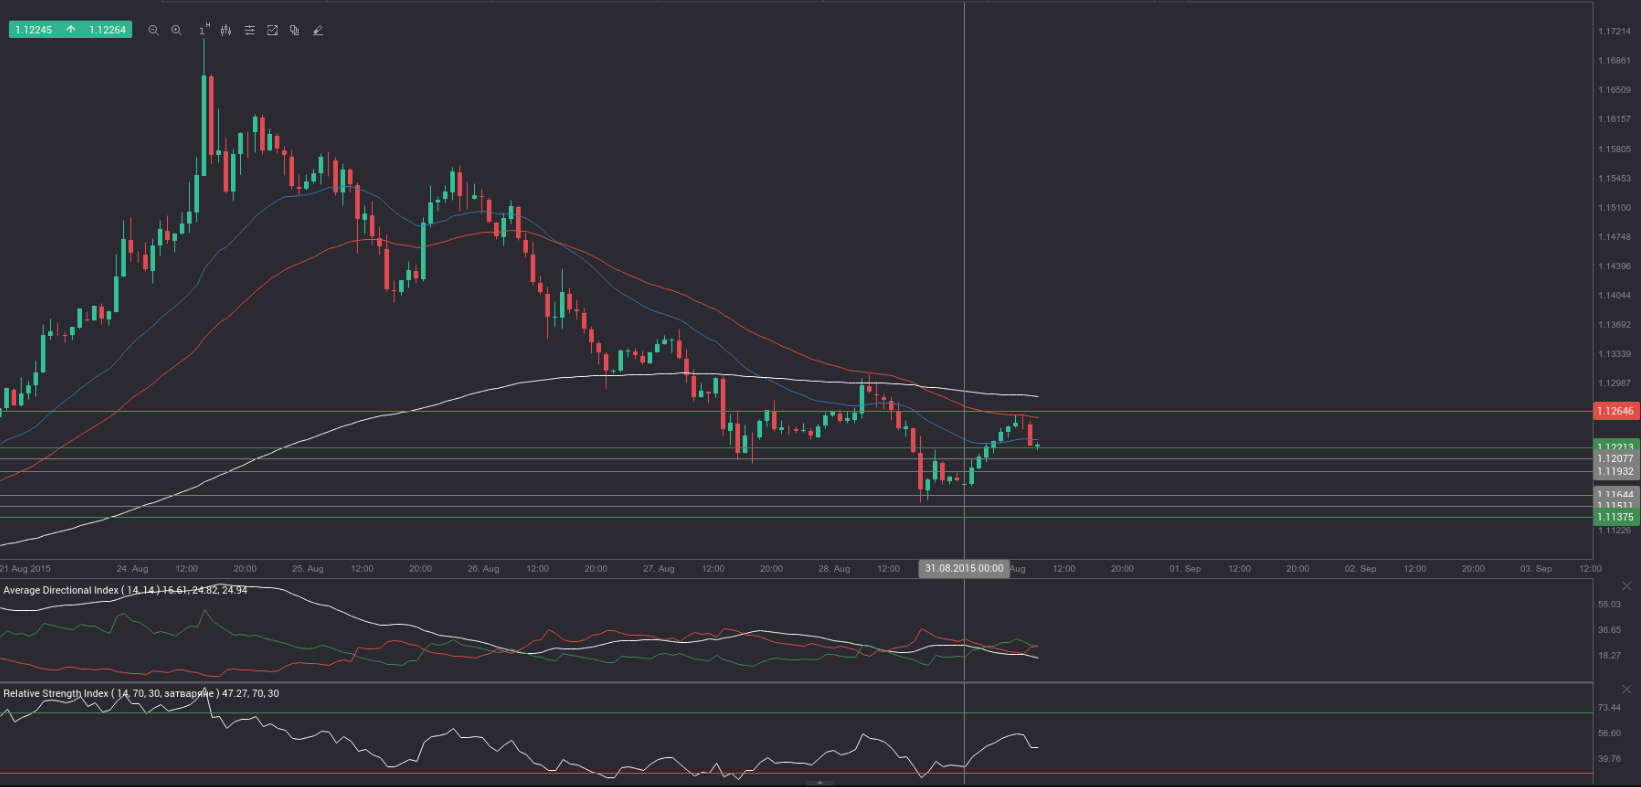
By employing the Camarilla calculation method, the daily pivot levels for EUR/USD are presented as follows:
R1 – 1.1193
R2 – 1.1207
R3 (range resistance – green on the 1-hour chart) – 1.1221
R4 (range breakout – red on the 1-hour chart) – 1.1264
S1 – 1.1165
S2 – 1.1151
S3 (range support – green on the 1-hour chart) – 1.1137
S4 (range breakout – red on the 1-hour chart) – 1.1094
By using the traditional method of calculation, the weekly pivot levels for EUR/USD are presented as follows:
Central Pivot Point – 1.1348
R1 – 1.1542
R2 – 1.1904
R3 – 1.2098
S1 – 1.0986
S2 – 1.0792
S3 – 1.0430