Yesterday’s trade saw EUR/USD within the range of 1.1289-1.1562. The pair closed at 1.1316, plunging 1.75% on a daily basis, or the most considerable daily loss since March 19th, when it plummeted 1.90%.
At 6:44 GMT today EUR/USD was up 0.23% for the day to trade at 1.1341. The pair touched a daily high at 1.1364 at 6:06 GMT.
Today the cross may be influenced by a number of macroeconomic reports as listed below.
Fundamentals
Euro area
Private Loans
Lending to individuals and business entities in the Euro areas private sector probably expanded a third consecutive month in July, rising at an annualized rate of 0.8%, according to market expectations. If so, this would be the fastest annual rate of increase in at least three years. In June the total value of private sector loans increased 0.6% year-on-year. In case lending expanded at a faster pace than anticipated, this would support demand for the euro, as it implies higher economic activity in the future in terms of consumer spending and business investments. The European Central Bank (ECB) is expected to release the official data at 8:00 GMT.
United States
Jackson Hole Symposium
The Jackson Hole Economic Policy Symposium is to commence today. Sponsored by the Federal Reserve Bank of Kansas City since 1978, the forum is attended by central bankers, policy experts, academics and financial market investors, who discuss a number of economic topics, including monetary policies.
Initial, Continuing Jobless Claims
The number of people in the United States, who filed for unemployment assistance for the first time during the business week ended on August 22nd, probably decreased to 275 000, according to market expectations, from 277 000 in the prior week. The latter has been the highest number of claims since the business week ended on July 10th, when 281 000 claims were reported.
The 4-week moving average, an indicator lacking seasonal effects, was 271 500, marking a decrease of 5 500 compared to the preceding weeks revised down average.
The business week, which ended on August 14th has been the 24th consecutive week, when jobless claims stood below the 300 000 threshold. This continues to support the case labor market conditions in the country follow the path of improvement. Claims are usually volatile during the summer period, as automakers shut assembly plants for annual retooling and also due to school vacations.
Initial jobless claims number is a short-term indicator, reflecting lay-offs in the country. In case the number of claims met expectations or dropped further, this would have a moderate bullish effect on the US dollar.
The number of continuing jobless claims probably decreased to the seasonally adjusted 2 250 000 during the business week ended on August 14th from 2 254 000 in the prior week. The latter represented a decrease by 24 000 compared to the revised up number of claims, reported in the business week ended on July 31st. This indicator reflects the actual number of people unemployed and currently receiving unemployment benefits, who filed for unemployment assistance at least two weeks ago.
The Department of Labor is to release the weekly report at 12:30 GMT.
Gross Domestic Product – second estimate
The second estimate of the US Gross Domestic Product probably pointed to an annualized rate of growth of 3.2% in the second quarter of 2015, according to the median forecast by analysts. The preliminary GDP estimate for Q2, reported on July 30th, pointed to an annual growth of 2.3%. In Q1 economy expanded at an annualized rate of 0.6%, according to final data. It was a revision up from a 0.2% contraction reported previously. The preliminary data showed that growth was supported by higher consumer spending in Q2, while business spending on equipment had a negative contribution.
Real personal consumption expenditures rose 2.9% during the second quarter, following an increase by 1.8% in Q1. Real non-residential fixed investment shrank 0.6% in Q2, after a 1.6% surge in Q1. Real exports of goods and services went up at an annualized rate of 5.3% in Q2, following a 6.0% drop during the first quarter, while real imports of goods and services rose 3.5% in Q2, after another 7.1% surge in the previous quarter. Real federal government consumption expenditures and gross investment shrank 1.1% in Q2, neutralizing the 1.1% increase during the first quarter, according to provisional data by the US Bureau of Economic Analysis.
In case the second GDP estimate outpaced expectations, this would provide a strong support to the US dollar. The revised GDP figure is due out at 12:30 GMT.
Pending Home Sales
The index of pending home sales in the United States probably rose 1.0% in July compared to June, according to the median estimate by experts. In June pending home sales unexpectedly shrank 1.8%, which has been the first monthly drop since December 2014.
In annual terms, the index of pending home sales rose 8.2% in June, or at the slowest rate since December 2014, when a climb rate of 6.1% was reported.
When a sales contract is accepted for a property, it is recorded as a pending home sale. As an indicator the index provides information on the number of future home sales, which are in the pipeline. It gathers data from real estate agents and brokers at the point of a sale and is currently the most accurate indicator regarding the US housing sector. It samples over 20% of the market. In addition, over 80% of pending house sales are converted to actual home sales within 2 or 3 months. Therefore, this index has a predictive value about actual home sales.
In case pending home sales increased more than anticipated, this would have a moderate bullish effect on the greenback. The National Association of Realtor’s (NAR) will release the official index value at 14:00 GMT.
Rate hike in October?
Market players have, for a while, anticipated the moment when the Federal Reserve Bank will finally raise borrowing costs following a decade-long hiatus. Most of them cited September as a possible month, when the rate hike could occur, while others bet on the December policy meeting.
However, following the recent turmoil in global markets, some analysts suggested a hike in September would probably be a premature move, while December was rather unlikely, as market liquidity tends to be thin during that period.
With three FOMC meetings on policy remaining until the end of the year, opinions appeared that a hike could be introduced in October.
Market players now see a 28% chance that the Federal Reserve Bank may raise borrowing costs at its September meeting, as they point to an average fed funds rate of 0.375% following the first hike.
There is a 37% probability that such a policy decision may occur in October, while the chance of such a move occurring in December is seen at 52%.
”We have to look at it more seriously,” said David Keeble, the head of fixed-income strategy at Credit Agricole SA in New York, cited by Bloomberg. ”You really want to be moving a little bit before December, otherwise your credibility starts to disappear.”
”An off-cycle hike in October is a possibility if September is too soon because of market jitters”, said Greg Anderson, the global head of foreign-exchange strategy at Bank of Montreal, cited by the same media.
Bond Yield Spread
The yield on German 2-year government bonds went as high as -0.219% on August 26th, or matching the high recorded during the prior day, after which it closed at the exact same level to gain 0.005 percentage point on a daily basis. It has been a second consecutive trading day of gains.
The yield on US 2-year government bonds climbed as high as 0.696% on August 26th, or the highest level since August 19th (0.738%), after which it fell to 0.680% at the close to add 7.1 basis points (0.071 percentage point) for the day and marking a second straight day of gains.
The spread between 2-year US and 2-year German bond yields, which reflects the flow of funds in a short term, widened to 0.899% on August 26th from 0.833% during the prior day. The August 26th yield spread has been the most notable one since August 20th, when the difference was 0.918%.
Meanwhile, the yield on German 10-year government bonds soared as high as 0.749% on August 26th, after which it slid to 0.711% at the close to lose 4.2 basis points (0.042 percentage point) compared to August 25th. It has been the first drop in the past three trading days.
The yield on US 10-year government bonds climbed as high as 2.193% on August 26th, or the highest level since August 19th (2.230%), after which it slipped to 2.168% at the close to add 9 basis points (0.09 percentage point) on a daily basis, while marking a second consecutive day of gains.
The spread between 10-year US and 10-year German bond yields widened to 1.457% on August 26th from 1.325% during the prior day. The August 26th yield difference has been the largest one since August 21st, when the spread was 1.473%.
Daily and Weekly Pivot Levels
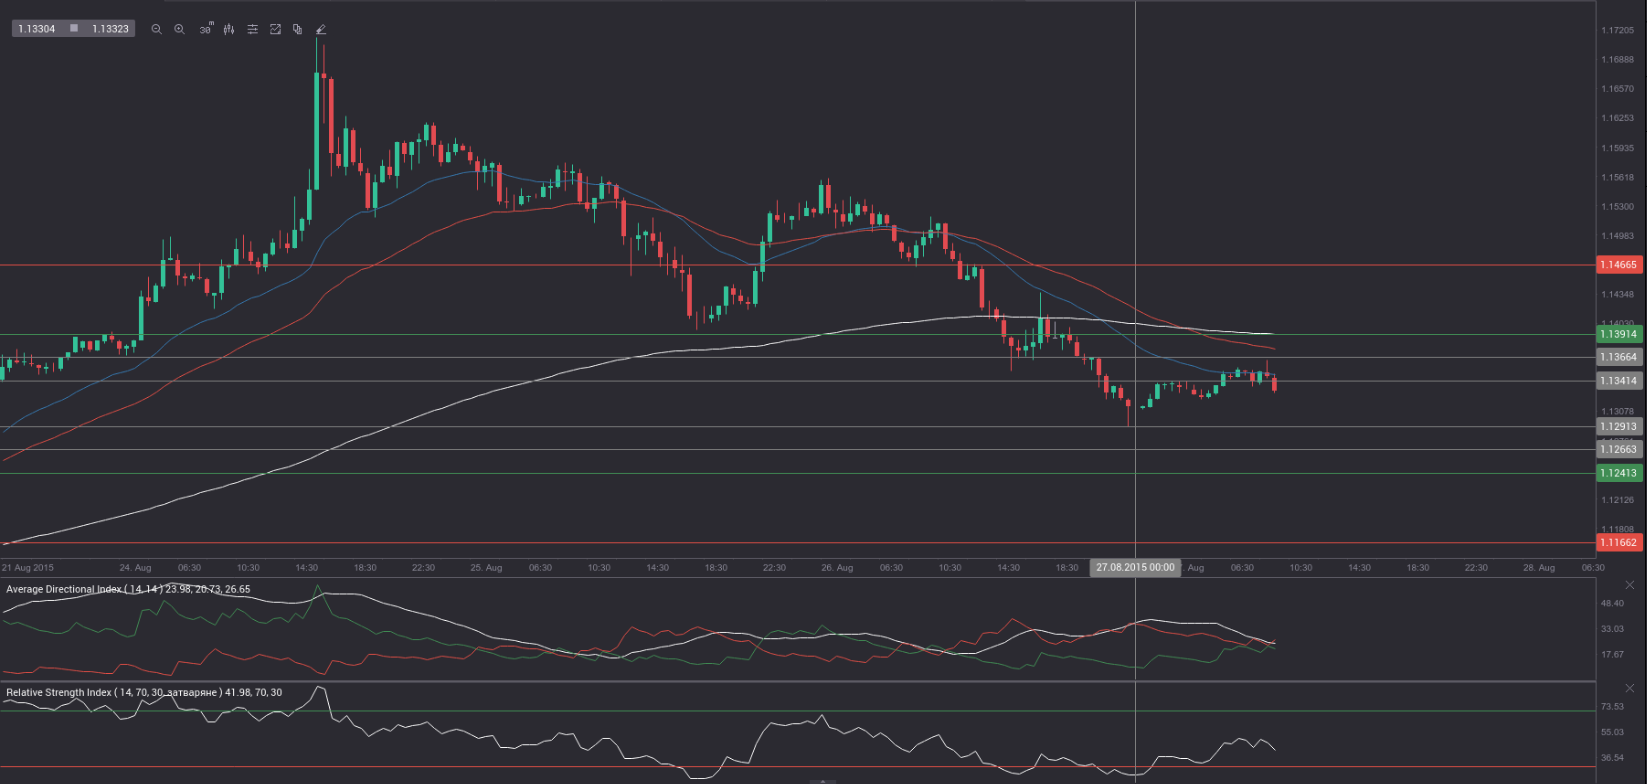
By employing the Camarilla calculation method, the daily pivot levels for EUR/USD are presented as follows:
R1 – 1.1341
R2 – 1.1366
R3 (range resistance – green on the 30-minute chart) – 1.1391
R4 (range breakout – red on the 30-minute chart) – 1.1466
S1 – 1.1291
S2 – 1.1266
S3 (range support – green on the 30-minute chart) – 1.1241
S4 (range breakout – red on the 30-minute chart) – 1.1166
By using the traditional method of calculation, the weekly pivot levels for EUR/USD are presented as follows:
Central Pivot Point – 1.1266
R1 – 1.1517
R2 – 1.1645
R3 – 1.1896
S1 – 1.1138
S2 – 1.0887
S3 – 1.0759