Friday’s trade saw USD/JPY within the range of 121.80-123.50. The pair closed at 122.03, plummeting 1.12% on a daily basis, or the most considerable daily loss since July 8th, when it depreciated 1.51%. The daily low has also been the lowest level since July 10th, when the cross registered a low of 121.25.
At 8:32 GMT today USD/JPY was losing 1.30% for the day to trade at 120.47. The pair overcame the lower range breakout level (S4), as it touched a daily low at 120.26 at 7:53 GMT. It has been the lowest level since May 19th, when a daily low of 119.80 was reached. Support will probably be received at key psychological level of 120.00.
No relevant macroeconomic reports and/or events are scheduled for today.
Boosted Safe Haven Demand
Demand for safe haven currencies such as the yen was bolstered on Monday, as shares in China plummeted 9% amid fears of a global macroeconomic slowdown led by China. “Markets are panicking. Things are starting look like the Asian financial crisis in the late 1990s. Speculators are selling assets that seem the most vulnerable,” said Takako Masai, head of research at Shinsei Bank in Tokyo, cited by Reuters.
A private report last week showed a further drop in Chinese manufacturing activity, with the preliminary manufacturing Purchasing Managers’ Index sliding to a 77-month low of 47.1 in August, worse than a projected drop to 47.7 from 47.8 in July, as both domestic and export demand decreased at a faster pace. The flash China General Manufacturing Output Index came in at a 45-month low of 46.6 from 47.1 in July.
The US dollar is losing ground due to concerns that current macroeconomic situation may be inappropriate for a rate hike by the Federal Reserve Bank in September. Regardless of that a federal funds rate target increase is broadly expected by the end of the year, it would likely be quite small, analysts project, which would leave interest rates in negative territory in real terms.
Correlation with other Majors
Taking into account the week ended on August 23rd and the daily closing levels of the major currency pairs, we come to the following conclusions in regard to the strength of relationship:
USD/JPY to USD/CHF (0.9694, or very strong)
USD/JPY to AUD/USD (0.7893, or strong)
USD/JPY to GBP/USD (-0.6733, or strong)
USD/JPY to USD/CAD (-0.9008, or very strong)
USD/JPY to NZD/USD (-0.9651, or very strong)
USD/JPY to EUR/USD (-0.9763, or very strong)
1. During the examined period USD/JPY moved almost equally in one and the same direction with USD/CHF.
2. USD/JPY moved strongly in the opposite direction compared to GBP/USD, while moving strongly in one and the same direction with AUD/USD during the past week.
3. USD/JPY moved almost equally in the opposite direction compared to USD/CAD, NZD/USD and EUR/USD during the period in question.
Bond Yield Spread
The yield on Japanese 2-year government bonds went as high as 0.007% on August 21st, after which it slid to 0.006% at the close to remain unchanged on a daily basis.
The yield on US 2-year government bonds climbed as high as 0.662% on August 21st, after which it fell to 0.621% at the close to lose 3.6 basis points (0.036 percentage point) for the day, while marking a third straight trading day of decrease.
The spread between 2-year US and 2-year Japanese bond yields, which reflects the flow of funds in a short term, shrank to 0.615% on August 21st from 0.651% during the prior day. The August 21st yield spread has been the lowest one since July 9th, when the difference was 0.608%.
Meanwhile, the yield on Japans 10-year government bonds soared as high as 0.363% on August 21st, after which it slid to 0.358% at the close to lose 0.004 percentage point compared to August 20th, while marking a second straight trading day of decline.
The yield on US 10-year government bonds climbed as high as 2.091% on August 21st, after which it slipped to 2.045% at the close to lose 2.8 basis points (0.028 percentage point) on a daily basis, while marking a third consecutive day of decrease.
The spread between 10-year US and 10-year Japanese bond yields narrowed to 1.687% on August 21st from 1.711% during the prior day. The August 21st yield difference has been the lowest one in more than three months.
Daily and Weekly Pivot Levels
By employing the Camarilla calculation method, the daily pivot levels for USD/JPY are presented as follows:
R1 – 122.19
R2 – 122.34
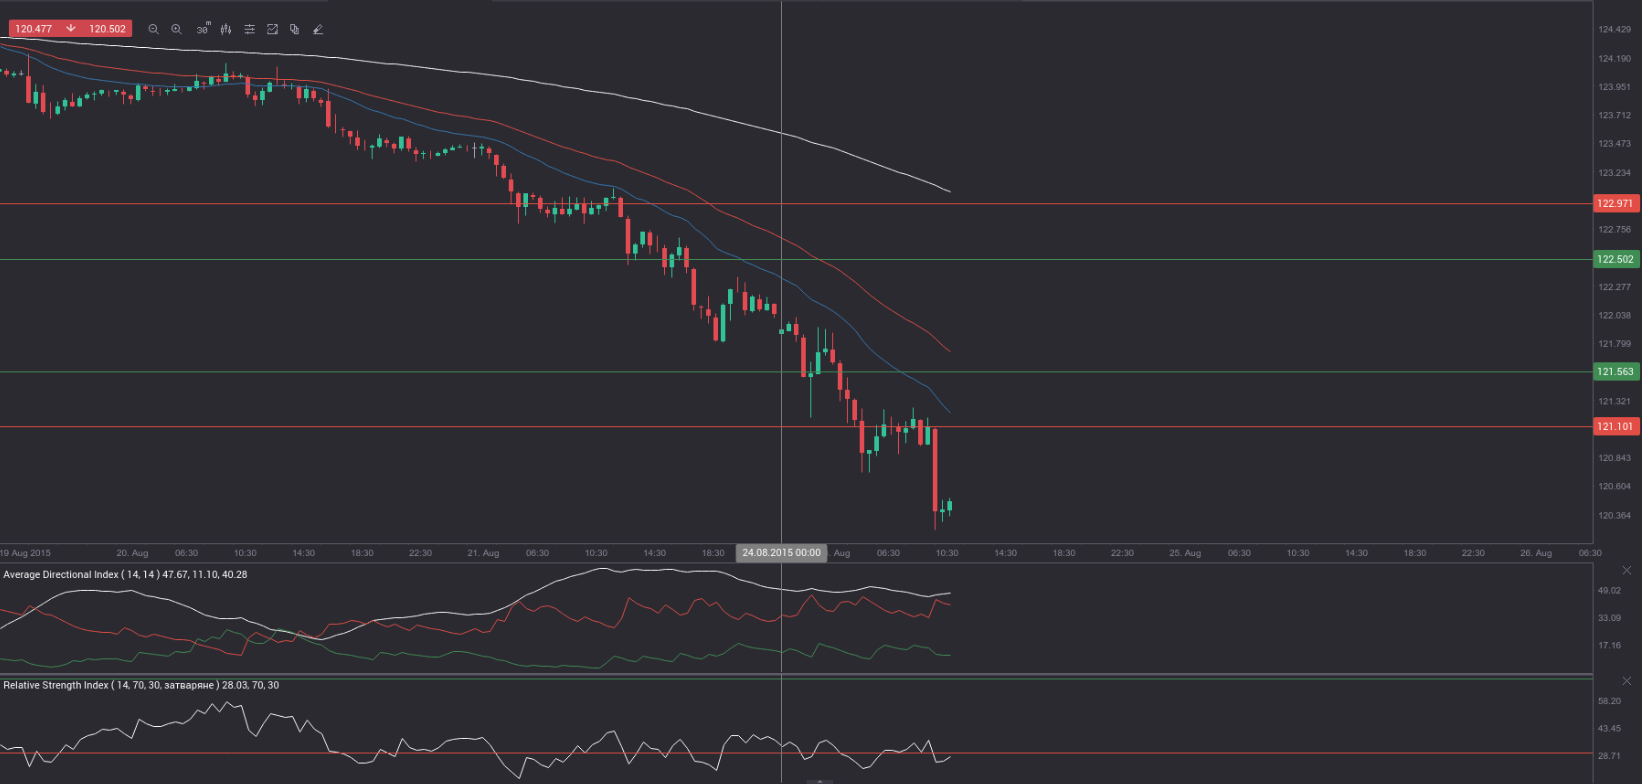
R3 (range resistance – green on the 30-minute chart) – 122.50
R4 (range breakout – red on the 30-minute chart) – 122.97
S1 – 121.87
S2 – 121.72
S3 (range support – green on the 30-minute chart) – 121.56
S4 (range breakout – red on the 30-minute chart) – 121.10
By using the traditional method of calculation, the weekly pivot levels for USD/JPY are presented as follows:
Central Pivot Point – 122.80
R1 – 123.81
R2 – 125.58
R3 – 126.59
S1 – 121.03
S2 – 120.02
S3 – 118.25