Yesterday’s trade saw EUR/USD within the range of 1.1015-1.1096. The pair closed at 1.1021, down 0.54% on a daily basis and marking the fourth consecutive trading day of losses. The daily rate of decrease has been the sharpest one since August 4th, when the pair fell 0.64%. In addition, the daily low has been the lowest level since August 11th, when the cross registered a low of 1.0959.
At 6:44 GMT today EUR/USD was up 0.39% for the day to trade at 1.1068. The pair overshot the upper range breakout level (R4), as it touched a daily high at 1.1073 at 6:40 GMT.
Today the cross may be influenced by a number of macroeconomic reports as listed below.
Fundamentals
Euro area
Current account
The surplus on Euro zones seasonally adjusted current account probably expanded to EUR 19.2 billion in June, according to the median forecast by experts, from EUR 18.0 billion in May.
The regions current account (without a seasonal adjustment) had a surplus of EUR 3.4 billion in May, which has been the lowest one since April 2012, when a figure of EUR 1.6 billion was reported.
The current account reflects the difference between savings and investments in the Euro area. It is the sum of the balance of trade, net current transfers (cash transfers) and net income from abroad (earnings from investments made abroad plus money sent by individuals working abroad to their families back home, minus payments made to foreign investors).
A current account surplus indicates that the net foreign assets of the region have increased by the respective amount, while a deficit suggests the opposite scenario. A country/region with a surplus on its current account is considered as a net lender to the rest of the world, while a current account deficit puts it in the position of a net borrower. A net lender is consuming less than it is producing, which means it is saving and those savings are being invested abroad, or foreign assets are created. A net borrower is consuming more than it is producing, which means that other countries are lending it their savings, or foreign liabilities are created. An expanding surplus or a contracting deficit on the areas current account usually has a limited bullish effect on the euro. The official data by the European Central Bank is due out at 8:00 GMT.
Construction output
At 9:00 GMT Eurostat is to report on construction activity in the Euro zone for June. Seasonally adjusted construction output in the region increased 0.3% in May compared to a month ago, which marked a third consecutive month of increase. In April output rose another 0.3%. In annual terms, output expanded at a pace of 0.3% in May, after remaining flat in April. This indicator reflects how resilient construction sector development is and also provides clues over investment activity. Higher rates of increase in output usually provide a limited support to the common currency, while higher rates of decline usually have the opposite effect.
United States
Consumer inflation
The annualized consumer inflation in the United States probably accelerated a second month in a row in July, reaching 0.2%, according to market expectations, up from 0.1% in June. The latter has been the first increase in annual consumer prices since December 2014. In monthly terms, the Consumer Price Index (CPI) probably rose 0.1% in July. If so, this would be the sixth consecutive month, during which consumer prices grew. In June the CPI went up at a monthly rate of 0.3%.
Energy prices plunged 15.0% year-on-year in June, while prices of commodities less food and energy slipped 0.4%. Upward pressure came from prices of food, which went up at an annualized rate of 1.8% in June, cost of shelter (+3% year-on-year), cost of transportation (+1.7%) and cost of medical care (+2.3%), according to the report by the Bureau of Labor Statistics.
The CPI is based on a basket of goods and services bought and used by consumers on a daily basis. In the United States the Bureau of Labor Statistics (BLS) surveys the prices of 80 000 consumer items in order to calculate the index. The latter reflects prices of commonly purchased items by primarily urban households, which represent about 87% of the US population. The Bureau processes price data from 23 000 retail and service businesses.
The CPI includes sales taxes, but excludes income taxes, costs of investments such as stocks and bonds and sales prices of homes.
The annualized core consumer inflation, which is stripped of prices of food and energy, probably continued to accelerate in July, reaching a level of 1.9%, up from 1.8% in June. If so, this would be the highest annual core inflation since July 2014, when a rate of 1.9% was registered. It is usually reported as a seasonally adjusted figure, because consumer patterns are widely fluctuating in dependence on the time of the year. The Core CPI is a key measure, because this is the gauge, which the Federal Reserve Bank takes into account in order to adjust its monetary policy. The Fed uses the core CPI, because prices of food, oil and gas are highly volatile, while the central bank’s tools are slow-acting. In case, for example, prices of oil plunge considerably, this could result in a low rate of inflation, but the central bank will not take action until this decrease affects prices of other goods and services.
If the CPI tends to approach the inflation objective, set by the Federal Reserve and considered as providing price stability, or a level below but close to 2%, this will usually bolster the appeal of the US dollar.
The Bureau of Labor Statistics is to release the official CPI report at 12:30 GMT.
FOMC Minutes
At 18:00 GMT the Federal Open Market Committee (FOMC) will release the minutes from its meeting on policy held on July 28th-29th. The minutes offer detailed insights on FOMC’s monetary policy stance. This release is closely examined by traders, as it may provide clues over interest rate decisions in the future. High volatility is usually present after the publication.
According to excerpts from the Federal Reserves most recent policy statement: “Information received since the Federal Open Market Committee met in June indicates that economic activity has been expanding moderately in recent months. Growth in household spending has been moderate and the housing sector has shown additional improvement; however, business fixed investment and net exports stayed soft. The labor market continued to improve, with solid job gains and declining unemployment.”
“The Committee continues to see the risks to the outlook for economic activity and the labor market as nearly balanced. Inflation is anticipated to remain near its recent low level in the near term, but the Committee expects inflation to rise gradually toward 2 percent over the medium term as the labor market improves further and the transitory effects of earlier declines in energy and import prices dissipate.”
“The Committee anticipates that it will be appropriate to raise the target range for the federal funds rate when it has seen some further improvement in the labor market and is reasonably confident that inflation will move back to its 2 percent objective over the medium term.”
Bond Yield Spread
The yield on German 2-year government bonds went as high as -0.241% on August 18th, or the highest level since August 7th (-0.237%), after which it closed at the same level to add 1.6 basis points (0.016 percentage point) on a daily basis, while marking a second consecutive trading day of gains.
The yield on US 2-year government bonds climbed as high as 0.730% on August 18th, or the exact high level as that reported on August 17th, after which it fell to 0.722% at the close to add 1.2 basis points (0.012 percentage point) for the day.
The spread between 2-year US and 2-year German bond yields, which reflects the flow of funds in a short term, shrank to 0.963% on August 18th from 0.967% during the prior day. The August 18th yield spread has been the lowest one since August 12th, when the difference was 0.948%.
Meanwhile, the yield on German 10-year government bonds soared as high as 0.662% on August 18th, after which it slid to 0.644% at the close to appreciate 1.3 basis points (0.013 percentage point) compared to August 17th.
The yield on US 10-year government bonds climbed as high as 2.203% on August 18th, or the highest level since August 14th (2.221%), after which it slipped to 2.194% at the close to add 2.4 basis points (0.024 percentage point) on a daily basis.
The spread between 10-year US and 10-year German bond yields expanded to 1.550% on August 18th from 1.539% during the prior day. The August 18th yield difference has been the largest one since August 13th, when the spread was 1.556%.
Daily and Weekly Pivot Levels
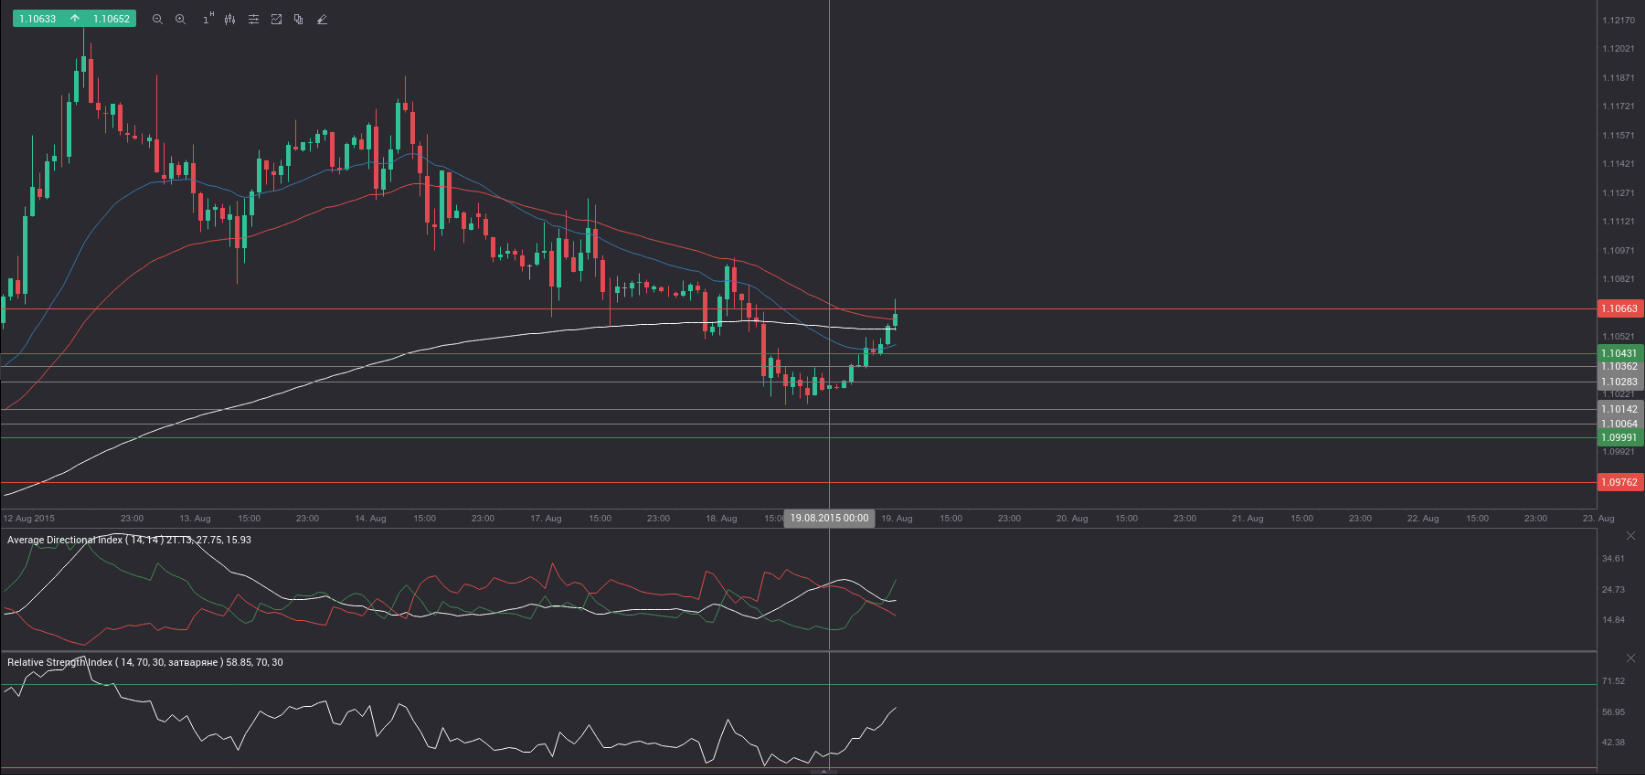
By employing the Camarilla calculation method, the daily pivot levels for EUR/USD are presented as follows:
R1 – 1.1028
R2 – 1.1036
R3 (range resistance – green on the 1-hour chart) – 1.1043
R4 (range breakout – red on the 1-hour chart) – 1.1066
S1 – 1.1014
S2 – 1.1006
S3 (range support – green on the 1-hour chart) – 1.0999
S4 (range breakout – red on the 1-hour chart) – 1.0976
By using the traditional method of calculation, the weekly pivot levels for EUR/USD are presented as follows:
Central Pivot Point – 1.1081
R1 – 1.1238
R2 – 1.1370
R3 – 1.1527
S1 – 1.0949
S2 – 1.0792
S3 – 1.0660