Yesterday’s trade saw GBP/JPY within the range of 193.71-195.23. The pair closed at 193.86, down 0.39% on a daily basis, or the first loss in the past three trading days. The daily high has also been the highest level since August 6th, when the cross registered a high of 195.28.
At 7:42 GMT today GBP/JPY was down 0.16% for the day to trade at 193.57. The pair is nearing the range support level (S3), as it touched a daily low at 193.54 at 7:41 GMT. It has been the lowest level since August 12th, when a daily low of 193.38 was reached.
Today the cross may be influenced by a number of macroeconomic reports as listed below.
Fundamentals
United Kingdom
Consumer inflation
The annual rate of inflation in the United Kingdom probably stood at 0% for a second consecutive month in July, according to the median estimate by experts. If so, this would be the 19th consecutive month, when annualized consumer prices remained below the 2-percent objective, set by the Bank of England. In May the rate of consumer inflation was 0.1%, while April saw the lowest inflation level ever recorded, -0.1%.
In June cost of food and non-alcoholic beverages dropped the most, or at an annualized rate of 2.2%, followed by cost of transportation (-1.8%), cost of recreation and culture (-1.0%), prices of clothing and footwear (-0.8%) and cost of furniture, household equipment and routine maintenance of the house (-0.3%). At the same time, prices were up for categories such as education (+10% year-on-year), alcoholic beverages and tobacco (+2.3%), restaurants and hotels (+1.9%), health (+1.6%), communication (+1.1%) and housing & utilities (+0.4%), according to the report by the Office for National Statistics.
The CPI is the main measure of inflation in the UK for macroeconomic purposes and forms the basis of the inflation target set by the government. Every month about 120 000 samples are made, examining the change in prices of about 650 products. They represent the “market basket” of goods and services, on which the index is based.
Key categories in the consumer price index are Transport (accounting for 16.2% of the total weight) and Housing, Water, Electricity, Gas and Other fuels with a 14.4% share. Recreation and Culture accounts for 13.4%, Restaurants and Hotels – 11.4% and Food and Non-alcoholic Beverages – 11.2%. The CPI also encompasses Miscellaneous Goods and Services (9.6%), Clothing and Footwear (6.5%), Furniture, Household Equipment and Maintenance (6.1%). Alcoholic Beverages and Tobacco, Health, Communication and Education comprise the remaining 11.2% of the total weight.
The annualized core consumer price inflation probably remained steady at 0.8% in July. If so, this would mark the 13th consecutive month, during which annual core inflation stood below the 2% target set by the Bank of England. In May the annualized core CPI increased 0.9%. This indicator measures the change in prices of goods and services purchased by consumers, without taking into account volatile components such as food, energy products, alcohol and tobacco.
In case the annual CPI came in line with expectations or further distanced from the central bank’s inflation objective, this would certainly reduce the appeal of the sterling. The Office for National Statistics (ONS) will publish the official CPI report at 8:30 GMT.
Japan
Merchandise Trade Balance
The gap on Japan’s merchandise trade balance probably narrowed to JPY 56.7 billion during July, according to the median forecast by experts, from a deficit of JPY 69.0 billion, registered in June. If so, this would be the fourth consecutive month of deficit, but on the other hand, it would be the smallest figure since March, when a trade gap of JPY 53.4 billion was reported.
Total exports rose at an annualized rate of 9.5% year-on-year to reach JPY 6,505.74 billion in June. Within the category, shipments to the United States rose the most (+17.6%), followed by sales to the Middle East (+13.9%). In addition, exports to Asia, which account for more than half of the countrys total exports, went up 10.1%, as shipments to India grew 17.3%, those to China rose 5.9%, to Hong Kong (+21.6%), to Singapore (+29.2%), to Taiwan (+14.8%), to South Korea (+9.5%) and to Vietnam (+38.7%).
At the same time, total imports dropped 2.9% year-on-year to JPY 6,574.79 billion in June. Inbound shipments were lower for raw materials (-2.6%) and for mineral fuels (-33.4%). Imports of foodstuffs went up 9.1%, those of chemicals increased 17.5%, of manufactured goods (+8.0%), of machinery (+8.5%) and of transport equipment (+31.6%).
During the period 1970-2010 Japan has had regular annual trade surpluses. Since 2011, on the other hand, the country has been recording trade deficits, because yen depreciation led to higher costs of imports, while increased purchases of fossil fuels and gas were aimed to neutralize the loss of nuclear power after the devastating earthquake and the tsunami in March 2011.
In case a smaller-than-expected trade deficit is reported, this will usually bolster demand for the yen. The Ministry of Finance will release the official trade data at 23:50 GMT.
Bond Yield Spread
The yield on Japanese 2-year government bonds went as high as 0.009% on August 17th, after which it closed at the same level to advance 0.003 percentage point on a daily basis.
The yield on UK 2-year government bonds climbed as high as 0.610% on August 17th, or the highest level since August 11th (0.620%), after which it fell to 0.586% at the close to gain 0.008 percentage point for the day, while marking the third consecutive trading day of gains.
The spread between 2-year UK and 2-year Japanese bond yields, which reflects the flow of funds in a short term, expanded a third day in a row on August 17th to reach 0.577% from 0.572% on August 14th. The August 17th difference has been the most considerable one since August 10th, when the yield spread was 0.617%.
Meanwhile, the yield on Japans 10-year government bonds soared as high as 0.400% on August 17th, or the highest level since August 11th (0.420%), after which it slid to 0.380% at the close to remain unchanged compared to August 14th.
The yield on UK 10-year government bonds climbed as high as 1.878% on August 17th, after which it slipped to 1.820% at the close to lose 5.9 basis points (0.059 percentage point) on a daily basis. It has been the first drop in the past three trading days.
The spread between 10-year UK and 10-year Japanese bond yields narrowed to 1.440% on August 17th from 1.499% on August 14th. The August 17th yield difference has been the lowest one since August 12th, when the spread was 1.429%.
Daily and Weekly Pivot Levels
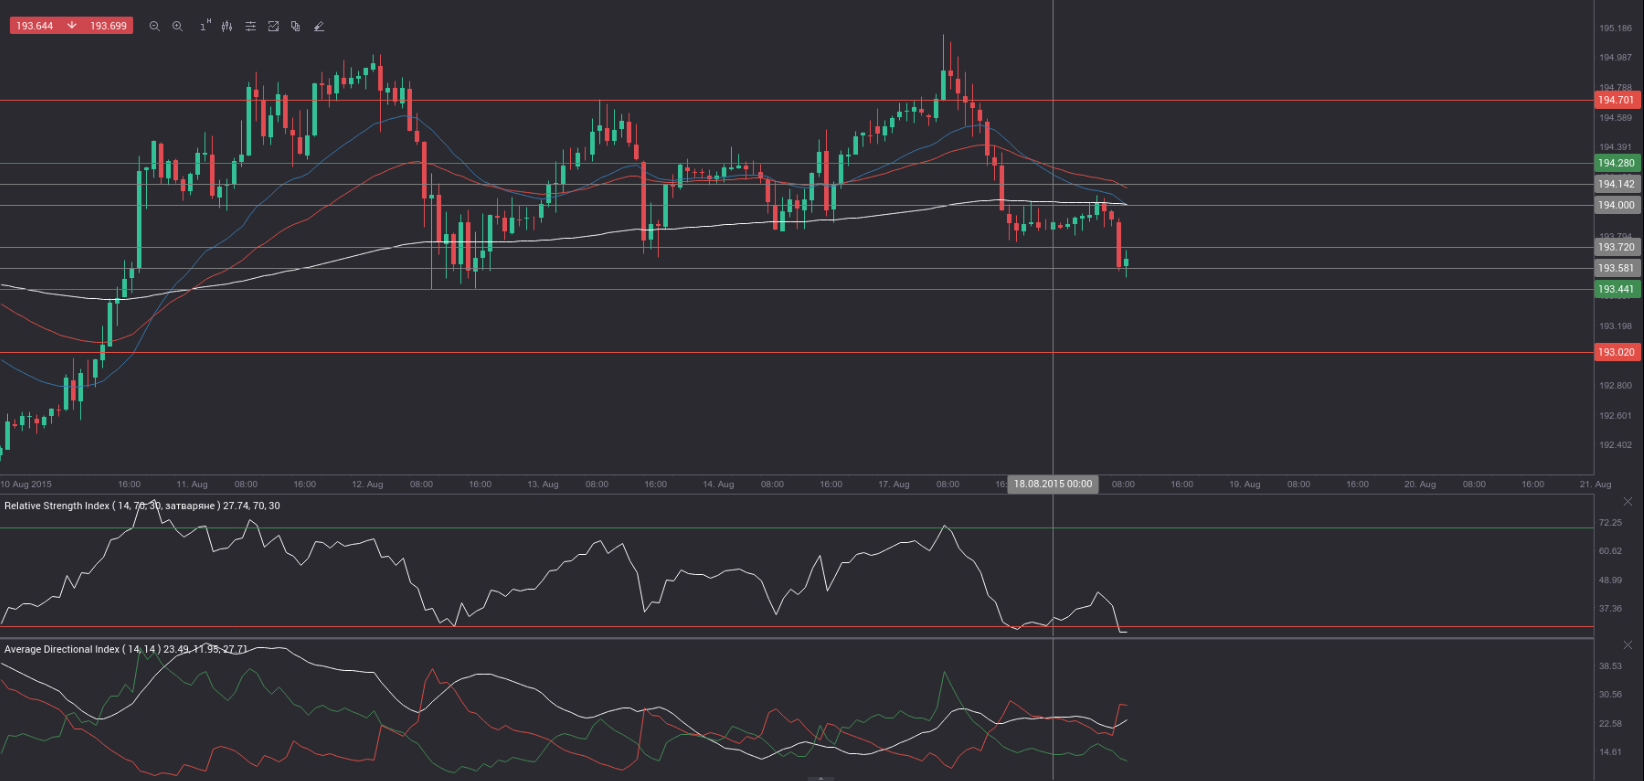
By employing the Camarilla calculation method, the daily pivot levels for GBP/JPY are presented as follows:
R1 – 194.00
R2 – 194.14
R3 (range resistance – green on the 1-hour chart) – 194.28
R4 (range breakout – red on the 1-hour chart) – 194.70
S1 – 193.72
S2 – 193.58
S3 (range support – green on the 1-hour chart) – 193.44
S4 (range breakout – red on the 1-hour chart) – 193.02
By using the traditional method of calculation, the weekly pivot levels for GBP/JPY are presented as follows:
Central Pivot Point – 193.91
R1 – 195.61
R2 – 196.75
R3 – 198.45
S1 – 192.77
S2 – 191.07
S3 – 189.93