Friday’s trade saw EUR/USD within the range of 1.1096-1.1188. The pair closed at 1.1106, down 0.39% on a daily basis and extending losses from Thursday. The daily rate of decrease has also been the steepest one since August 4th, when the cross fell 0.64%.
At 7:14 GMT today EUR/USD was down 0.38% for the day to trade at 1.1069. The pair is set to test the lower range breakout level (S4), as it touched a daily low at 1.1063 at 7:11 GMT. It has been the lowest level since August 12th, when a daily low of 1.1023 was reached.
Today the cross may be influenced by a number of macroeconomic reports as listed below.
Fundamentals
Euro area
Balance of Trade
At 9:00 GMT Eurostat is expected to report on the euro regions trade balance for June. The regions trade surplus, without a seasonal adjustment, was reported to have shrunk to EUR 18.8 billion in May, or the lowest figure since January 2015, from the record high surplus of EUR 24.9 billion in April. Total exports rose at an annualized rate of 3% to reach EUR 164.4 billion in May, while imports remained stable at EUR 145.6 billion.
Taking into account the entire European Union, total exports grew 4% year-on-year to reach EUR 145.8 billion in May, while total imports dropped at an annualized rate of 1% to EUR 139.5 billion. This resulted in a EUR 6.3 billion surplus in May. Exports to the United States, South Korea and India marked the largest increase (+22%, +18% and +17%, respectively). At the same time, imports from the United States, China and Turkey rose the most (+24%, +19% and +12%, respectively).
Euro zones balance of trade produces regular surpluses mainly due to the high export of manufactured goods, such as machinery and vehicles. At the same time, the region is a net importer of energy and raw materials. Member states such as Germany, Italy, France and Netherlands play a key role in total trade.
The trade balance, as an indicator, measures the difference in value between the region’s exported and imported goods and services during the reported period. It reflects the net export of goods and services, or one of the components to form the Gross Domestic Product. Generally, exports imply how strong economic growth might be, while imports indicate how strong domestic demand is. In case the trade balance surplus continued to shrink, this would have a moderate bearish effect on the euro.
United States
New York Empire State Manufacturing Index
The New York Empire State Manufacturing Index probably increased to a reading of 5.00 in August, according to the median forecast by experts, from 3.86 in the prior month. If so, this would be the highest index level since February, when a value of 6.90 was reported.
The index is based on the monthly Empire State Manufacturing Survey, which is conducted by the Federal Reserve Bank of New York. About 200 top manufacturing executives respond to a questionnaire, sent out during the first day of the month. They provide their estimates in regard to the performance of several business indicators from the prior month, while also forecasting performance during the upcoming six months.
The ”general business conditions” component of the index is based on a distinct question, posed on the Empire State Manufacturing Survey, which means it is not a weighted average of the other indicators. These indicators, which are only applicable to the manufacturing facilities of survey respondents in the region of New York, include new orders, shipments, unfilled orders, delivery time, inventories, prices paid, prices received, number of employees including contract workers, average employee work week, technology spending and capital expenditures.
The general business conditions component and the sub-indexes for the 11 indicators are calculated by subtracting the percentage of respondents, rating an indicator as ”lower” (a drop), from the percentage of respondents, rating the same indicator as ”higher” (an increase). In case 33% of survey respondents stated that business conditions had improved during the current month, 50% stated that conditions had not changed, and 17% of the respondents stated that conditions had deteriorated, the index would have a reading of 16. Readings above 0.00 are indicative of improving business conditions in the region. Higher-than-anticipated index values will usually have a moderate bullish effect on the US dollar. The Federal Reserve Bank of New York is expected to release the official reading at 12:30 GMT.
NAHB Housing Market Index
The National Association of Home Builders (NAHB) Housing Market Index probably rose a third consecutive month in August, reaching 61.0, according to market expectations, from 60.0 in July. If so, this would be the 14th consecutive month, when the gauge stood in the area above 50.0, and also the highest index value in more than 8 years. The indicator is based on a monthly survey in regard to current home sales and expected sales in the coming six months. Values above the key level of 50.0 indicate that housing market conditions are good. Therefore, higher-than-projected readings would provide support to the greenback. The official data is scheduled for release at 14:00 GMT.
Correlation with other Majors
Taking into account the week ended on August 16th and the daily closing levels of the major currency pairs, we come to the following conclusions in regard to the strength of relationship:
EUR/USD to GBP/USD (0.6439, or strong)
EUR/USD to NZD/USD (0.0871, or very weak)
EUR/USD to AUD/USD (0.0324, or very weak)
EUR/USD to USD/CAD (-0.2455, or weak)
EUR/USD to USD/JPY (-0.7526, or strong)
EUR/USD to USD/CHF (-0.8800, or very strong)
1. During the examined period EUR/USD moved strongly in one and the same direction with GBP/USD, while moving strongly in the opposite direction compared to USD/JPY.
2. EUR/USD moved almost equally in the opposite direction compared to USD/CHF during the past week.
3. The correlation between EUR/USD and USD/CAD was insignificant during the past week.
4. EUR/USD moved almost independently compared to NZD/USD and AUD/USD during the period in question.
Bond Yield Spread
The yield on German 2-year government bonds went as high as -0.262% on August 14th, or the highest level since August 10th (-0.254%), after which it slid to -0.267% at the close to remain unchanged on a daily basis.
The yield on US 2-year government bonds climbed as high as 0.738% on August 14th, or the highest level since August 10th (0.741%), after which it fell to 0.726% at the close to gain 1.7 basis points (0.017 percentage point) for the day, while marking a second consecutive trading day of increase.
The spread between 2-year US and 2-year German bond yields, which reflects the flow of funds in a short term, expanded to 0.993% on August 14th from 0.976% during the prior day. The August 14th spread has been the most notable one since August 10th, when the difference was 0.998%.
Meanwhile, the yield on German 10-year government bonds soared as high as 0.663% on August 14th, or the highest level since August 11th (0.679%), after which it slid to 0.657% at the close to appreciate 2.4 basis points (0.024 percentage point) compared to August 13th, while marking a second straight day of gains.
The yield on US 10-year government bonds climbed as high as 2.221% on August 14th, or the highest level since August 11th (2.232%), after which it slipped to 2.201% at the close to add 1.2 basis points (0.012 percentage point) on a daily basis, while marking a third consecutive day of gains.
The spread between 10-year US and 10-year German bond yields narrowed to 1.544% on August 14th from 1.556% during the prior day. The August 14th yield difference has been the lowest one since August 12th, when the spread was 1.543%.
Daily and Weekly Pivot Levels
By employing the Camarilla calculation method, the daily pivot levels for EUR/USD are presented as follows:
R1 – 1.1114
R2 – 1.1123
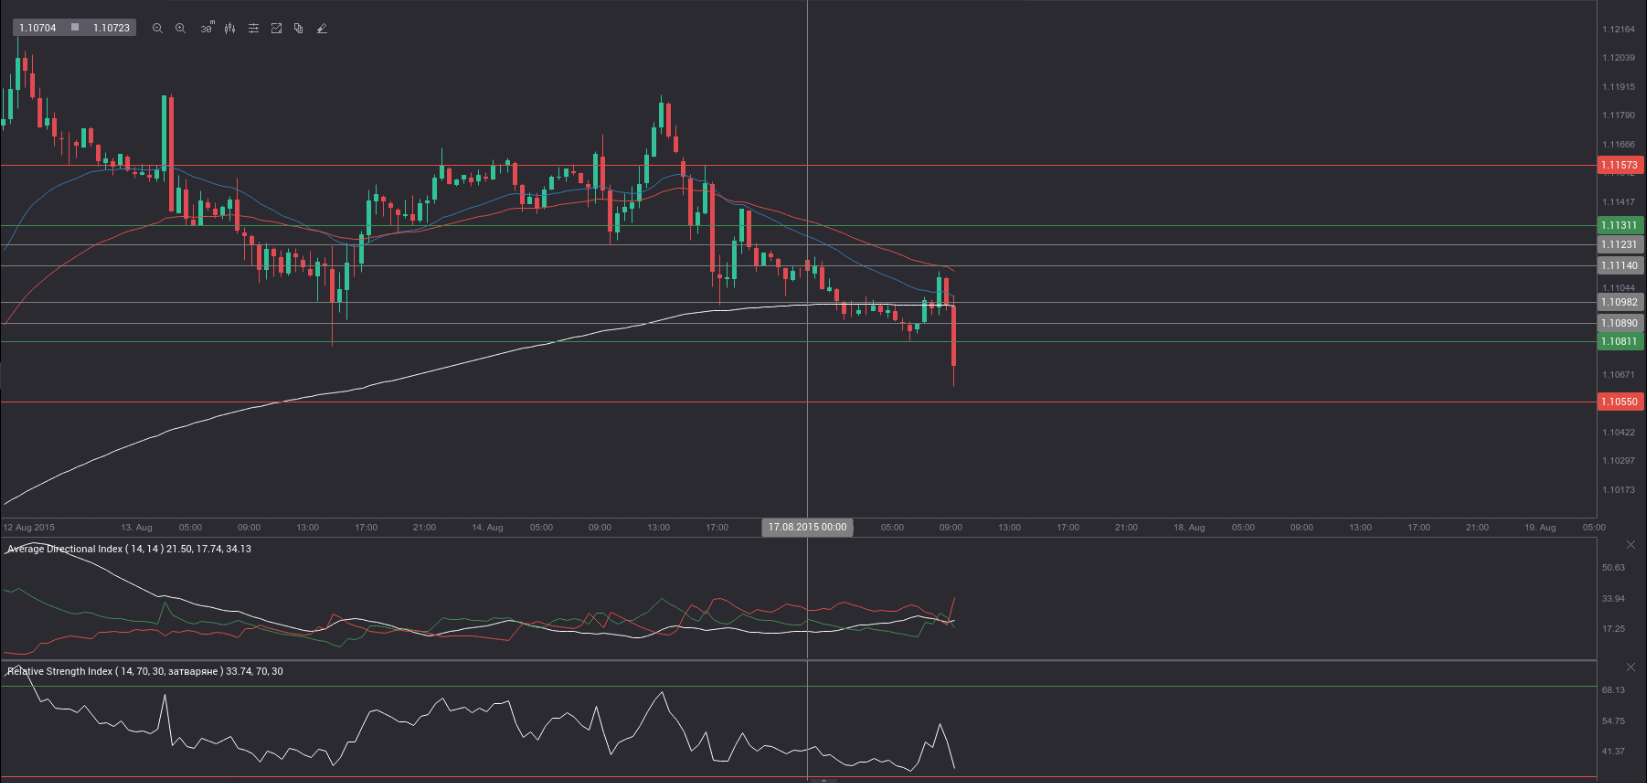
R3 (range resistance – green on the 30-minute chart) – 1.1131
R4 (range breakout – red on the 30-minute chart) – 1.1157
S1 – 1.1098
S2 – 1.1089
S3 (range support – green on the 30-minute chart) – 1.1081
S4 (range breakout – red on the 30-minute chart) – 1.1055
By using the traditional method of calculation, the weekly pivot levels for EUR/USD are presented as follows:
Central Pivot Point – 1.1081
R1 – 1.1238
R2 – 1.1370
R3 – 1.1527
S1 – 1.0949
S2 – 1.0792
S3 – 1.0660