Yesterday’s trade saw EUR/USD within the range of 1.1055-1.1214. The pair closed at 1.1157, soaring 1.06% on a daily basis, or the most considerable daily gain since July 27th, when it appreciated 1.11%. The daily high has also been the highest level since July 10th, when the cross registered a high of 1.1218.
At 6:41 GMT today EUR/USD was down 0.35% for the day to trade at 1.1119. The pair is set to test the range support level (S3), as it touched a daily low at 1.1118 at 6:42 GMT.
Today the cross may be influenced by a number of macroeconomic reports as listed below.
Fundamentals
Euro area
ECB Monetary Policy Meeting Accounts
At 11:30 GMT the European Central Bank is expected to release the accounts from its latest policy meeting, held on July 16th. This document offers a fair and balanced reflection of policy deliberations, with its objective being to provide the rationale behind monetary policy decisions and let the public receive a better understanding of the ECB Governing Council’s assessment of macroeconomic conditions.
The key refinancing rate was left intact at the record low level of 0.05% in line with market expectations. The central bank also decided to lift the Emergency Liquidity Assistance to Greek banks by EUR 900 million. The rates on the marginal lending facility and the deposit facility were kept unchanged at 0.30% and -0.20%, respectively.
According to the Introductory Statement to the Press Conference offered by ECB President Mario Draghi: “Regarding non-standard monetary policy measures, the asset purchase programmes continue to proceed smoothly. As explained on previous occasions, our monthly asset purchases of €60 billion are intended to run until the end of September 2016 and, in any case, until we see a sustained adjustment in the path of inflation that is consistent with our aim of achieving inflation rates below, but close to, 2% over the medium term. When carrying out its assessment, the Governing Council will follow its monetary policy strategy and concentrate on trends in inflation and the medium-term outlook for price stability.”
“Looking ahead, we expect the economic recovery to broaden further. Domestic demand should be further supported by our monetary policy measures and their favourable impact on financial conditions, as well as by the progress made with fiscal consolidation and structural reforms.”
“The downside risks surrounding the economic outlook for the euro area have generally been contained as a result of our monetary policy decisions, as well as oil price and exchange rate developments.”
“Supported by the expected economic recovery, the impact of the lower euro exchange rate and the assumption embedded in oil futures markets of somewhat higher oil prices in the years ahead, inflation rates are expected to pick up further during 2016 and 2017.”
In case the accounts were to present a hawkish economic outlook, the common currency would receive support, while a dovish outlook would usually lead to a sell-off.
United States
Retail Sales
Retail sales in the United States probably rose 0.5% in July on a monthly basis, according to the median forecast by experts. In June sales recorded an unexpected 0.3% drop, or the first monthly decline since February, when the index slipped 0.5%. The June result was due to lower sales of automobiles and an array of other goods.
Among the 13 major categories, 7 registered decreases, while 1 showed no change. Sales of furniture fell at the steepest rate in June (-1.6%), followed by sales of clothing and footwear (-1.5%), building materials and garden equipment (-1.3%) and motor vehicles (-1.1%). On the other hand, sales at electronics and appliance stores surged 1%, sales at gasoline stations were up 0.8%, while sales of sporting goods, hobby, music and books were up 0.1%, according to the report by the US Census Bureau.
Annualized retail sales surged 1.4% in June, following a 2.3% climb in May. The latter has been the most considerable annual increase since January, when retail sales rose 3.7%.
The report on retail sales reflects the dollar value of merchandise sold within the retail trade by taking a sampling of companies, operating in the sector of selling physical end products to consumers. The retail sales report encompasses both fixed point-of-sale businesses and non-store retailers, such as mail catalogs and vending machines. The Census Bureau, which is a part of the Department of Commerce, surveys about 5 000 companies of all sizes, from huge retailers such as Wal-Mart to independent small family firms.
US core retail sales, or retail sales ex autos, probably went up 0.5% in July compared to a month ago. In June core sales dipped 0.1%, which followed three consecutive months of increases. This indicator removes large ticket prices and historical seasonality of automobile sales.
The retail sales index is considered as a coincident indicator, thus, it reflects the current state of the economy. It is also considered a pre-inflationary indicator, which investors can use in order to reassess the probability of an interest rate hike or cut by the Federal Reserve Bank. In addition, this indicator provides key information regarding consumer spending trends. Consumer expenditures, on the other hand, account for almost two-thirds of the US Gross Domestic Product. Therefore, a larger-than-expected rate of increase in sales would certainly boost the US dollar. The official report is due out at 12:30 GMT.
Initial, Continuing Jobless Claims
The number of people in the United States, who filed for unemployment assistance for the first time during the business week ended on August 7th, probably remained unchanged at 270 000, according to market expectations.
The business week, which ended on July 31st has been the 22nd consecutive week, when jobless claims stood below the 300 000 threshold. This boosts the case labor market conditions in the country continued to improve. Claims are usually volatile during the summer period, as automakers shut assembly plants for annual retooling and also due to school vacations.
The 4-week moving average, an indicator lacking seasonal effects, was 268 250, marking a decrease of 6 500 compared to the preceding weeks unrevised average.
Initial jobless claims number is a short-term indicator, reflecting lay-offs in the country. In case the number of claims met expectations or dropped further, this would have a bullish effect on the US dollar.
The number of continuing jobless claims probably decreased to the seasonally adjusted 2 247 000 during the business week ended on July 31st from 2 255 000 in the prior week. The latter represented a decrease by 14 000 compared to the revised up number of claims, reported in the week ended on July 24th. This indicator reflects the actual number of people unemployed and currently receiving unemployment benefits, who filed for unemployment assistance at least two weeks ago.
The Department of Labor is to release the weekly report at 12:30 GMT.
Bond Yield Spread
The yield on German 2-year government bonds went as high as -0.271% on August 12th, after which it closed at the same level to gain 0.004 percentage point on a daily basis. It has been the first gain in the past five trading days.
The yield on US 2-year government bonds climbed as high as 0.681% on August 12th, after which it fell to 0.665% at the close to lose 1.2 basis points (0.012 percentage point) for the day, while marking a second consecutive day of decline.
The spread between 2-year US and 2-year German bond yields, which reflects the flow of funds in a short term, shrank a second straight day on August 12th to reach 0.936% from 0.952% during the prior day. The August 12th spread has been the lowest one since August 3rd, when the difference was 0.900%.
Meanwhile, the yield on German 10-year government bonds soared as high as 0.641% on August 12th, after which it slid to 0.612% at the close to lose 1.7 basis points (0.017 percentage point) compared to August 11th, while marking a second straight day of decrease.
The yield on US 10-year government bonds climbed as high as 2.157% on August 12th, after which it slipped to 2.141% at the close to lose 0.002 percentage point on a daily basis, while marking a second consecutive day of decline.
The spread between 10-year US and 10-year German bond yields widened to 1.529% on August 12th from 1.514% during the prior day. The August 12th yield difference has been the largest one since August 10th, when the spread was 1.534%.
Daily and Weekly Pivot Levels
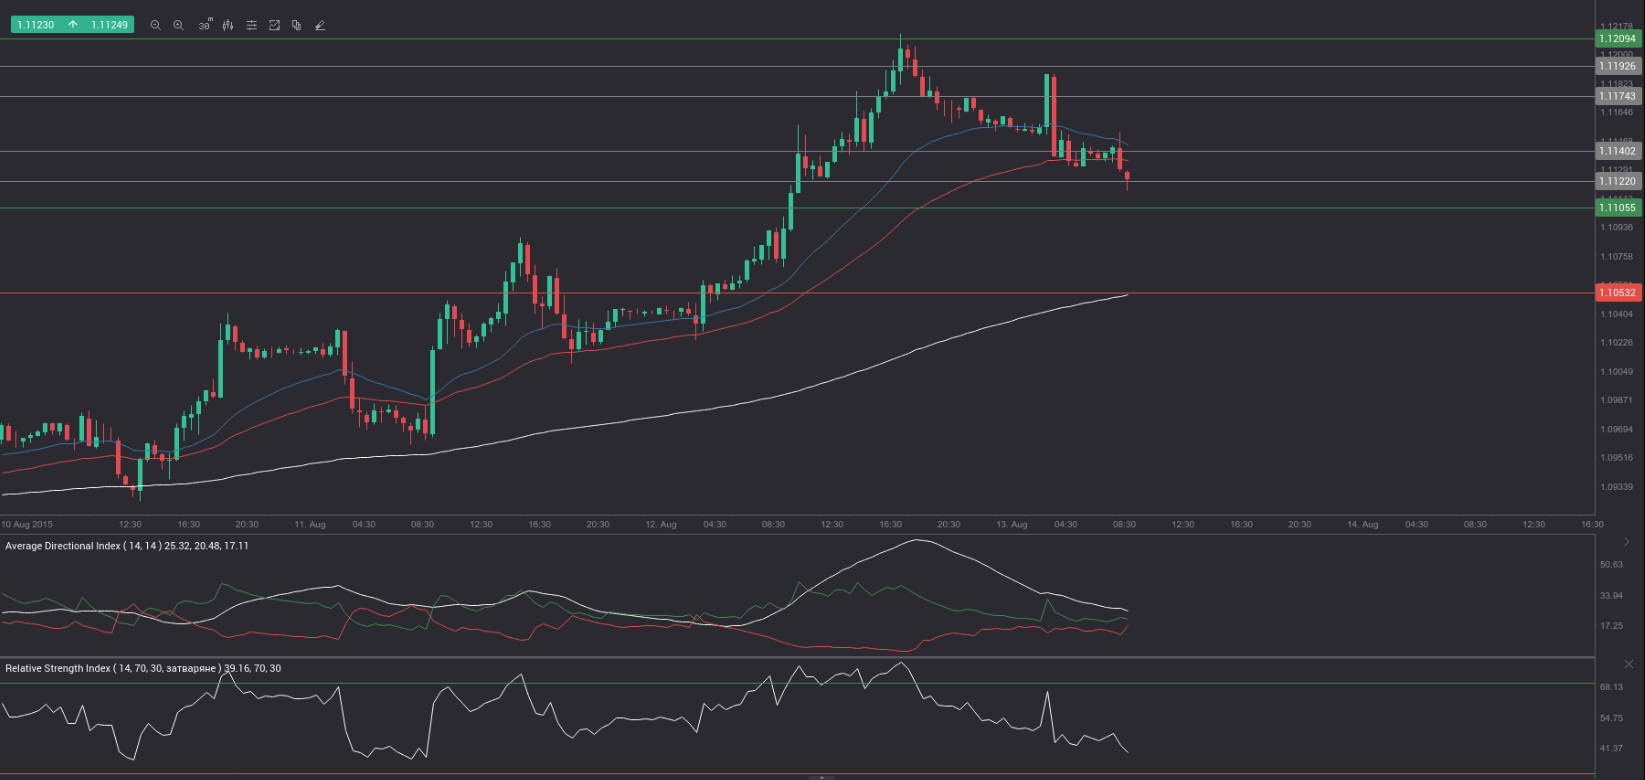
By employing the Camarilla calculation method, the daily pivot levels for EUR/USD are presented as follows:
R1 – 1.1174
R2 – 1.1192
R3 (range resistance – green on the 30-minute chart) – 1.1209
R4 (range breakout – red on the 30-minute chart) – 1.1262
S1 – 1.1140
S2 – 1.1122
S3 (range support – green on the 30-minute chart) – 1.1105
S4 (range breakout – red on the 30-minute chart) – 1.1053
By using the traditional method of calculation, the weekly pivot levels for EUR/USD are presented as follows:
Central Pivot Point – 1.0938
R1 – 1.1029
R2 – 1.1089
R3 – 1.1180
S1 – 1.0878
S2 – 1.0787
S3 – 1.0727