Yesterday’s trade saw GBP/JPY within the range of 191.86-193.97. The pair closed at 192.24, falling 0.68% on a daily basis, or the most considerable daily loss since July 8th, when it depreciated 2.12%. The daily low has also been the lowest level since July 14th, when the cross registered a low of 190.53.
At 9:09 GMT today GBP/JPY was down 0.15% for the day to trade at 191.98. The pair touched a daily low at 191.66 at 7:20 GMT. It is now the new lowest level since July 14th.
No relevant macroeconomic reports are scheduled to be released from the United Kingdom and Japan today.
Bond Yield Spread
The yield on Japanese 2-year government bonds went as high as 0.010% on July 23rd, after which it slid to 0.007% at the close to lose 0.003 percentage point on a daily basis, while marking a second consecutive day of decline.
The yield on UK 2-year government bonds climbed as high as 0.684% on July 23rd, or the highest level since June 26th (0.716%), after which it fell to 0.632% at the close to lose 0.009 percentage point for the day.
The spread between 2-year UK and 2-year Japanese bond yields, which reflects the flow of funds in a short term, narrowed to 0.625% on July 23rd from 0.636% during the prior day. The July 23rd difference has been the lowest one since July 16th, when the yield spread was 0.598%.
Meanwhile, the yield on Japan’s 10-year government bonds soared as high as 0.422% on July 23rd, after which it slid to 0.418% at the close to gain 0.002 percentage point compared to July 22nd, while marking the first gain in the past three days.
The yield on UK 10-year government bonds climbed as high as 2.041% on July 23rd, after which it slipped to 1.997% at the close to lose 2.9 basis points (0.029 percentage point) on a daily basis, while marking a second consecutive day of decline.
The spread between 10-year UK and 10-year Japanese bond yields shrank to 1.579% on July 23rd from 1.605% during the prior day. The July 23rd yield difference has been the lowest one since July 9th, when the spread was 1.543%.
Technical Commentary
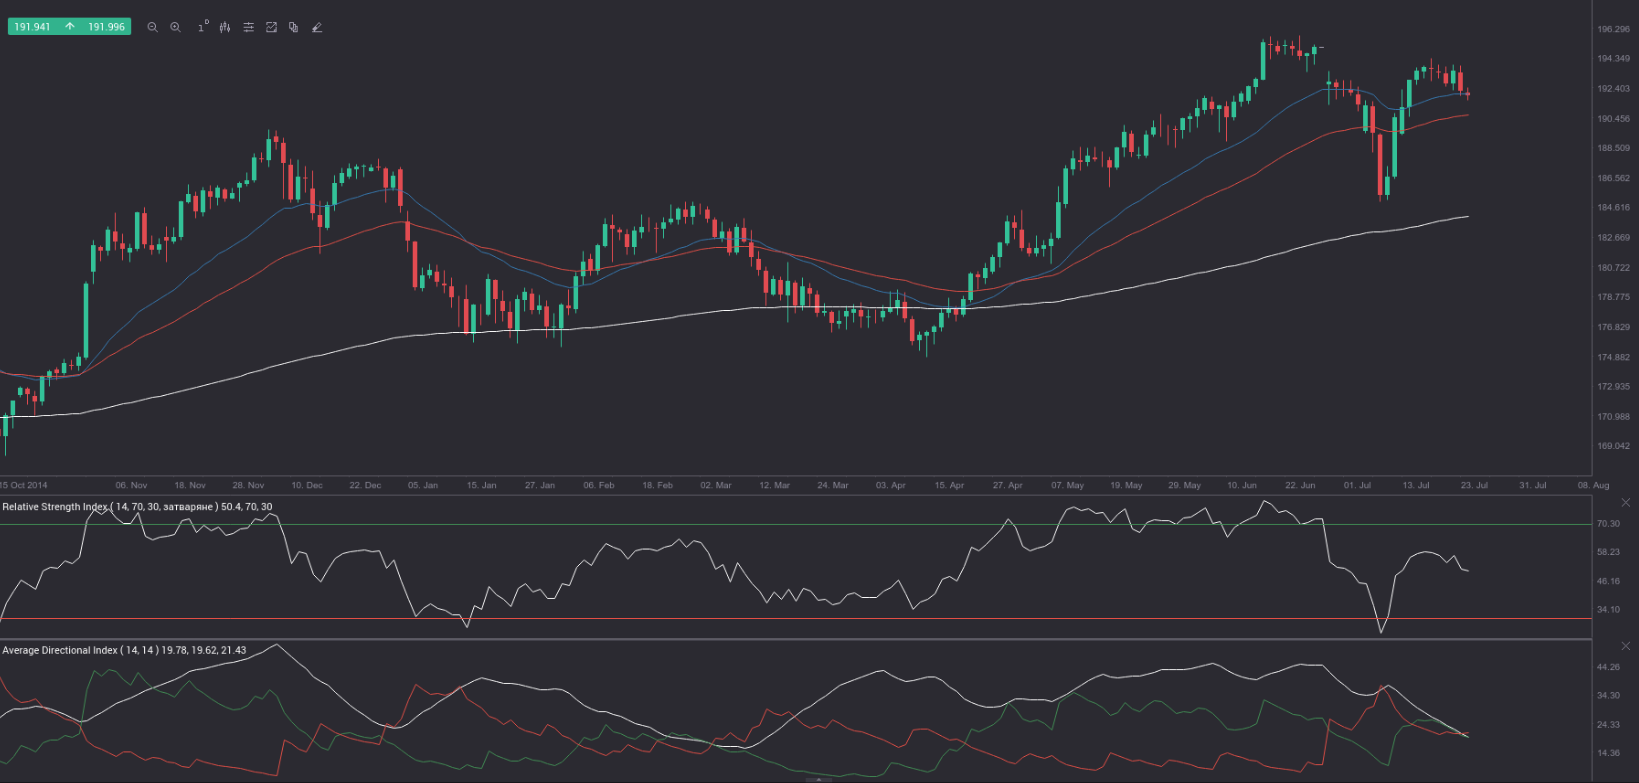
The bullish move is showing signs of exhaustion, as the pair tested the June 26th high of 195.28 with a lower high on July 17th at 194.38 (the red spinning top bar that followed a string of six consecutive bull-trend bars on the daily chart). The Average Directional Movement Index (ADX) (white on the chart) also points to exhaustion, as it moved below its 30.00 level and even fell below the key 20.00 level, indicating movement within a range. The +DI (green) and the -DI (red) are currently moving in a parallel manner, also indicating a trading range. The Relative Strength Index (RSI) is approaching its 50.00 level from above, again pointing to exhaustion of the up move.
GBP/JPY overshot the 25-day Exponential Moving Average (blue) and is now attempting to break below it. In case the range breakout is to the downside, the pair will probably find support within the area 190.70-191.25. A break below that area may drive the pair down to test the July 14th low of 190.53.
Pivot Points
According to Binary Tribune’s daily analysis, the central pivot point for the pair is at 192.69. In case GBP/JPY manages to breach the first resistance level at 193.52, it will probably continue up to test 194.80. In case the second key resistance is broken, the pair will probably attempt to advance to 195.63.
If GBP/JPY manages to breach the first key support at 191.41, it will probably continue to slide and test 190.58. With this second key support broken, the movement to the downside will probably continue to 189.30.
The mid-Pivot levels for today are as follows: M1 – 189.94, M2 – 191.00, M3 – 192.05, M4 – 193.11, M5 – 194.16, M6 – 195.22.
In weekly terms, the central pivot point is at 192.31. The three key resistance levels are as follows: R1 – 195.74, R2 – 197.80, R3 – 201.23. The three key support levels are: S1 – 190.25, S2 – 186.82, S3 – 184.76.