Friday’s trade saw USD/JPY within the range of 121.25-122.89. The pair closed at 122.75, surging 1.16% on a daily basis, or the most considerable daily gain since May 26th, when it appreciated 1.28%. The daily high has also been the highest level since July 7th, when the cross registered a high of 122.89. USD/JPY lost 0.05% during the week ended on July 12th, which marked a second consecutive weekly decline.
At 9:33 GMT today USD/JPY was up 0.58% for the day to trade at 123.48. The pair broke the daily R1 level and touched a daily high at 123.50 at 9:07 GMT. It has been the highest level since July 2nd, when a daily high of 123.75 was reached.
Fundamentals
United States
Monthly Budget Statement
The United States probably recorded a government budget surplus of USD 40.0 billion in June, according to market expectations, after a deficit of USD 82.4 billion during the previous month. The latter was a 37% decrease compared to May 2014. In May total receipts were at the amount of USD 212 billion, or a 6% increase compared to the same month a year earlier, while total outlays were recorded at USD 295 billion during the period, down 11%. The May 2014 deficit was inflated, as June 1st fell on a Saturday, which required the government to mail out USD 35 billion in June benefit payments in May of last year. The US government has had a deficit in May for 60 of the past 61 years, according to the report by the US Treasury.
A larger-than-projected budget surplus would have a certain bullish effect on the greenback. The Financial Management Service is to publish the official figure at 18:00 GMT.
Japan
Industrial Production
Japanese industrial output shrank 2.1% in May on a monthly basis, the Ministry of Economy, Trade and Industry reported at 4:30 GMT on Monday. The final estimate came in line with the median forecast by experts. The monthly rate of decrease has been the most notable since February, when production slumped at a final rate of 3.1%. The preliminary report, released on June 28th, showed a 2.2% decline in Japanese output in May.
In annual terms, Japans industrial output contracted 3.9% in May, following another 4.0% drop in the preceding month.
Agreement on Greek debt
Demand for safe haven currencies, such as the yen, was trimmed on Monday, after an all-night debate Euro leaders came to an agreement over a third bailout for Greece and to keep the country within the common currency zone.
“Euro summit has unanimously reached agreement. All ready to go for ESM programme for Greece with serious reforms and financial support”, the European Council President Donald Tusk tweeted.
“Its positive that theyve reached an agreement and it should be positive for risk in general,” said Vasileios Gkionakis, the Global Head of FX Strategy at UniCredit, cited by Reuters. “We are seeing a dip in the euro at the moment. But that is because of the moves at the end of last week; generally this should bode well.”
Bond Yield Spread
The yield on Japanese 2-year government bonds went as high as 0.035% on July 10th, or the highest level since April 2nd (0.036%), after which it slid to 0.010% at the close to gain 0.001 percentage point on a daily basis.
The yield on US 2-year government bonds climbed as high as 0.657% on July 10th, or the highest level since July 2nd (0.716%), after which it fell to 0.645% at the close to gain 6 basis points (0.06 percentage point) for the day.
The spread between 2-year US and 2-year Japanese bond yields, which reflects the flow of funds in a short term, expanded to 0.635% on July 10th from 0.608% during the prior day. The July 10th difference has been the most considerable one since July 1st, when the yield spread was 0.687%.
Meanwhile, the yield on Japans 10-year government bonds soared as high as 0.465% on July 10th, or the highest level since July 8th (0.465%), after which it slid to 0.450% at the close to appreciate 3.3 basis points (0.033 percentage point) compared to July 9th. It has been the first gain in the past five days.
The yield on US 10-year government bonds climbed as high as 2.421% on July 10th, or the highest level since July 2nd (2.470%), after which it slipped to 2.401% at the close to add 8.4 basis points (0.084 percentage point) on a daily basis, while marking a second consecutive day of gains.
The spread between 10-year US and 10-year Japanese bond yields widened to 1.951% on July 10th from 1.935% during the prior day. The July 10th yield difference has been the largest one since July 1st, when the spread was 1.968%.
Long-term Technical Outlook
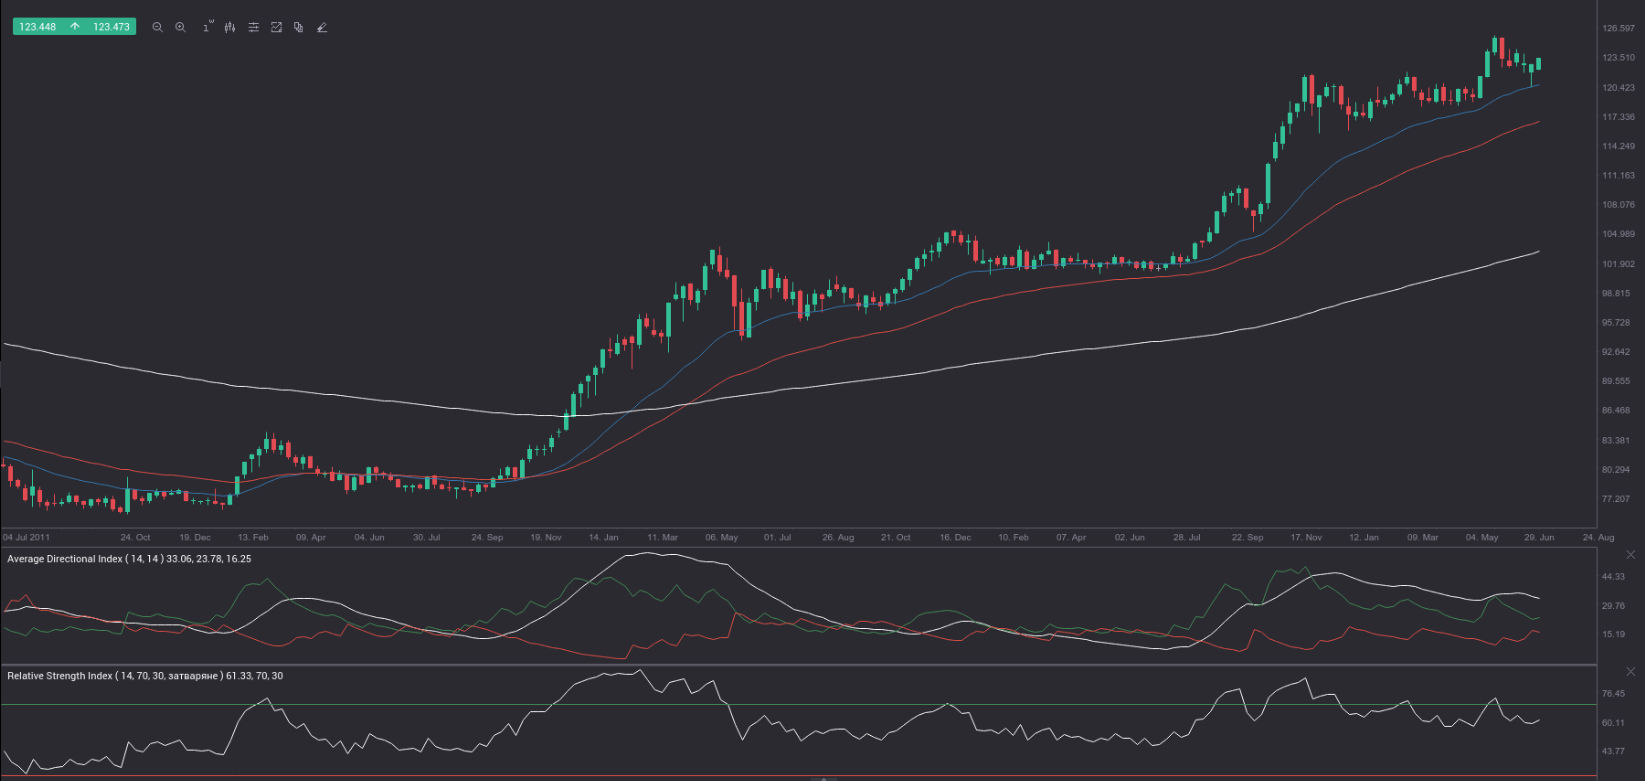
The bull trend, which began in late 2012 as a ”spike and channel trend”, is still developing. The perfect order of the 25-day (blue on the weekly chart), the 50-day (red) and the 200-day (white) Exponential Moving Averages is intact, as USD/JPY found support on several occassions at the 25-day EMA. In addition, the Relative Strength Index (RSI) is conveniently above its 50.00 level and still far from overbought, while the ADX is above the level of 25.00. The +DI (green) has crossed above the -DI (red) and the distance between them is set to widen.
In case we witness a break and a close above the June 5th 2015 high of 125.86 (the highest level in at least 8 years), we expect continuation of the bull trend in the upcoming weeks.
Pivot Points
According to Binary Tribune’s daily analysis, the central pivot point for the pair is at 122.30. In case USD/JPY manages to breach the first resistance level at 123.34, it will probably continue up to test 123.94. In case the second key resistance is broken, the pair will probably attempt to advance to 124.98.
If USD/JPY manages to breach the first key support at 121.70, it will probably continue to slide and test 120.66. With this second key support broken, the movement to the downside will probably continue to 120.06.
The mid-Pivot levels for today are as follows: M1 – 120.36, M2 – 121.18, M3 – 122.00, M4 – 122.82, M5 – 123.64, M6 – 124.46.
In weekly terms, the central pivot point is at 122.02. The three key resistance levels are as follows: R1 – 123.67, R2 – 124.58, R3 – 126.23. The three key support levels are: S1 – 121.11, S2 – 119.46, S3 – 118.55.