Friday’s trade saw EUR/USD within the range of 1.1055-1.1214. The pair closed at 1.1158, soaring 0.88% on a daily basis, or the most considerable daily gain since June 29th, when it appreciated 2.38%. The daily high has also been the highest level since June 30th, when the cross registered a high of 1.1245.
At 7:30 GMT today EUR/USD was up 0.03% for the day to trade at 1.1162. The pair touched a daily high at 1.1197 at 6:57 GMT.
Fundamentals
Euro area
Debates on the Greek situation
Emergency debates on Greece remaining within the common currency bloc were stalled after Greek Prime Minister Tsipras refused to accept creditor demands regarding the establishment of an independent fund in order to sell state assets. German Chancellor Angela Merkel said that Greece needs to pledge assets to the fund in order to raise about EUR 50 billion. According to an EU official, the Greek PM Tsipras responded that he did not have his mandate to sell half of the country.
Earlier on Monday the common currency lost some ground against its major peers, as Greece was expected to pass legislation on austerity in three days time before negotiating in detail with the troika.
“Market reaction in the euro is surprisingly muted,” said Steven Englander, global head of Group-of-10 currency strategy at Citigroup Inc., in an e-mail, cited by Bloomberg. “The absence of agreement and toughness of terms are eye-catching, but investors are waiting for the outcome more than trying to anticipate it.”
United States
Monthly Budget Statement
The United States probably recorded a government budget surplus of USD 40.0 billion in June, according to market expectations, after a deficit of USD 82.4 billion during the previous month. The latter was a 37% decrease compared to May 2014. In May total receipts were at the amount of USD 212 billion, or a 6% increase compared to the same month a year earlier, while total outlays were recorded at USD 295 billion during the period, down 11%. The May 2014 deficit was inflated, as June 1st fell on a Saturday, which required the government to mail out USD 35 billion in June benefit payments in May of last year. The US government has had a deficit in May for 60 of the past 61 years, according to the report by the US Treasury.
A larger-than-projected budget surplus would have a certain bullish effect on the greenback. The Financial Management Service is to publish the official figure at 18:00 GMT.
Bond Yield Spread
The yield on German 2-year government bonds went as high as -0.197% on July 10th, or the highest level since June 26th (-0.183%), after which it slid to -0.207% at the close to gain 4.4 basis points (0.044 percentage point) on a daily basis.
The yield on US 2-year government bonds climbed as high as 0.657% on July 10th, or the highest level since July 2nd (0.716%), after which it fell to 0.645% at the close to gain 6 basis points (0.06 percentage point) for the day.
The spread between 2-year US and 2-year German bond yields shrank to 0.852% on July 10th from 0.869% during the prior day. The latter has been the most notable spread since July 2nd, when the difference was 0.875%.
Meanwhile, the yield on German 10-year government bonds soared as high as 0.899% on July 10th, or the highest level since July 2nd (0.903%), after which it slid to 0.896% at the close to appreciate 16.6 basis points (0.166 percentage point) compared to July 9th, while marking a third straight day of gains.
The yield on US 10-year government bonds climbed as high as 2.421% on July 10th, or the highest level since July 2nd (2.470%), after which it slipped to 2.401% at the close to add 8.4 basis points (0.084 percentage point) on a daily basis, while marking a second consecutive day of gains.
The spread between 10-year US and 10-year German bond yields narrowed to 1.505% on July 10th from 1.613% during the prior day. The July 10th yield difference has been the lowest one since July 3rd, when the spread was 1.478%.
Technical Outlook
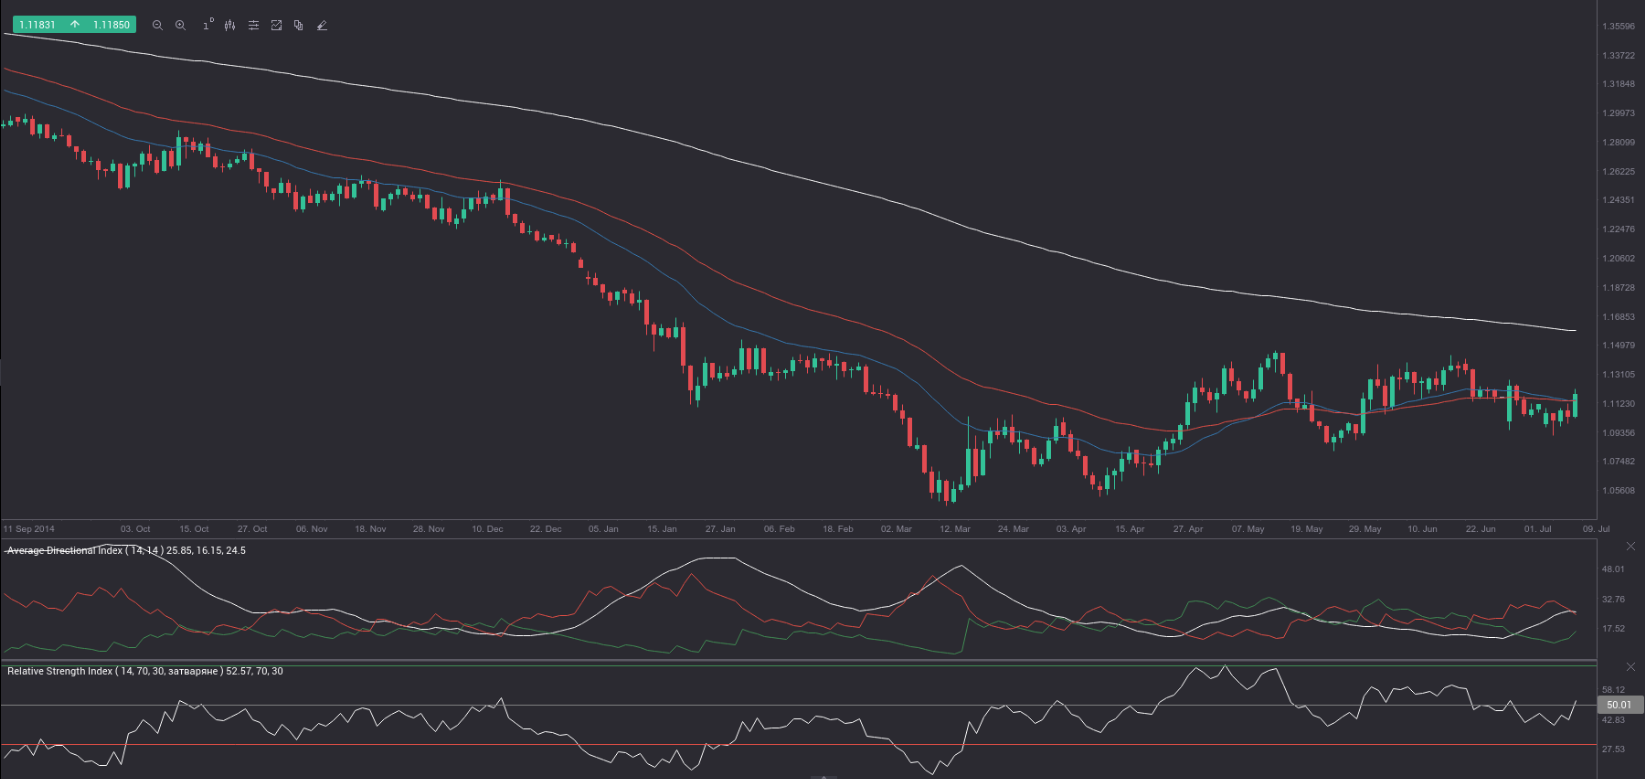
EUR/USD has been in a sharp decline since the last prominent daily high (May 8th 2014) at 1.3992. The down move drove the pair to its lowest level since January 9th 2003 at 1.0460 on March 13th 2015 (the first bottom). The cross was deeply oversold (the Relative Strength Index below its 30.00) and when the RSI moved back above 30.00, a reasonable signal to buy was submitted.
However, the up move was a pullback to the 25-day Exponential Moving Average (blue on the daily chart) and the pair went as far as the March 26th 2015 high of 1.1052. A test of that high occurred on April 6th 2015, but it was a failed attempt to break above it (a lower high of 1.1038). Therefore, the move to the downside resumed and a second prominent low at 1.0519 formed (April 13th 2015).
A fairly good double bottom formation occurred. We consider it as a fairly good pattern, because the two bottoms are not identical. However, they appear within 5% of each other. The formation was confirmed by a close above the March 26th high in late April.
With the price piercing the 25-day and the 50-day EMAs, the RSI moving above its key 50.00, and the +DI (green) crossing above the -DI (red), a good buy signal was generated. EUR/USD went up as far as the May 15th high of 1.1467, when overbought conditions were present.
From this point on the pair has been moving in a relatively wide trading range, defined by four major points: the May 15th high of 1.1467, the May 27th low of 1.0817, the June 18th high of 1.1438 and the July 7th low of 1.0916. A strong zone of support has formed between 1.0880 and 1.0920, while a notable resistance area has formed between 1.1390 and 1.1440. A breakout and a close beyond either of the two areas could set the stage for the medium-to-long term trend.
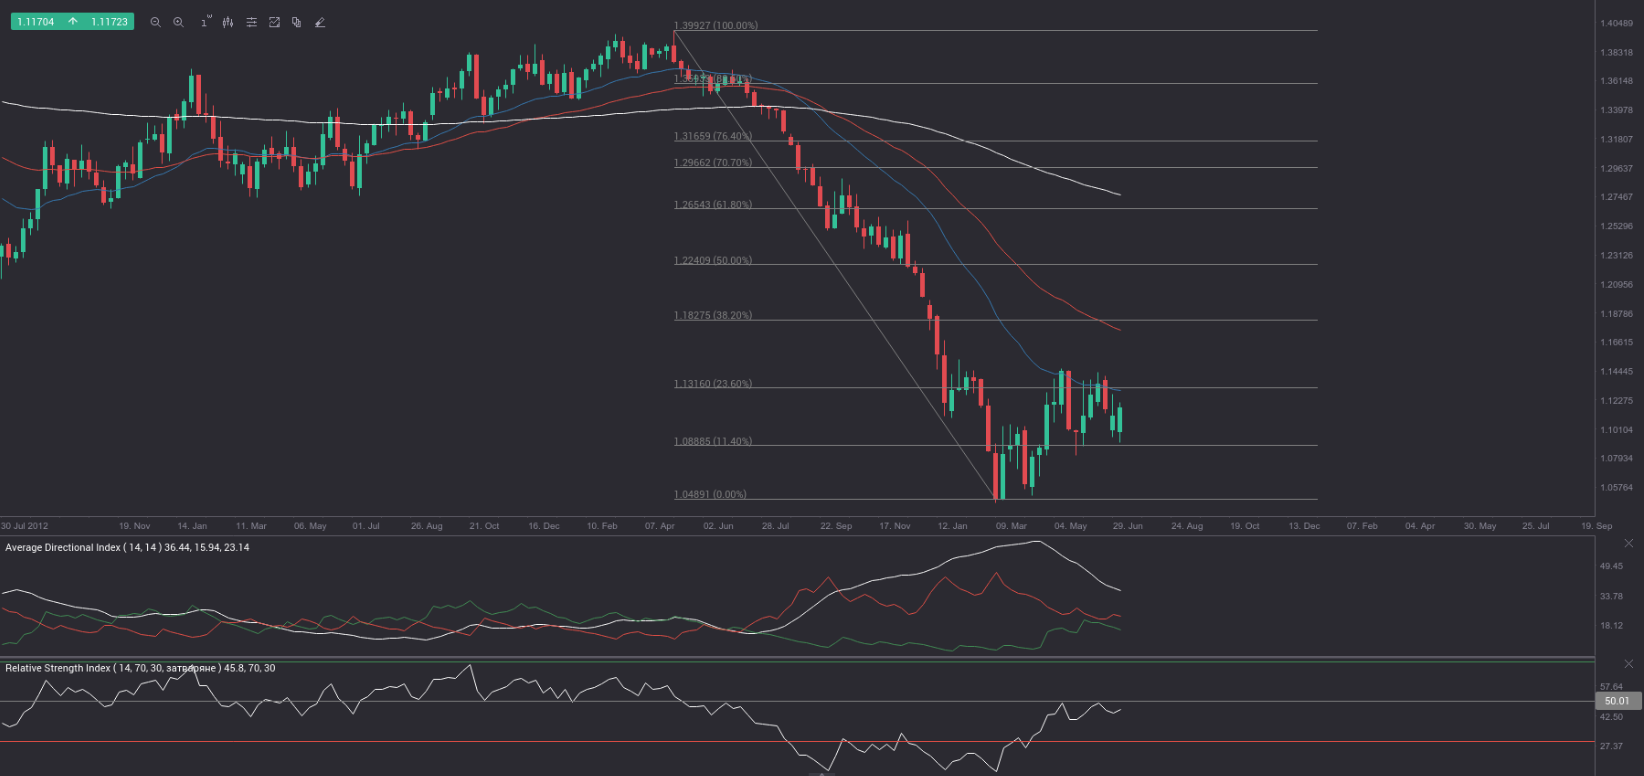
By applying the Fibonacci Correction from the May 8th 2014 high to March 13th 2015 low on the weekly chart, we can see that the recent gains are part of a pullback to the major downtrend. In case this pullback was halted at the 38.20% level or somewhere in the area between the 38.20% and the 61.80% Fibonacci levels, we could anticipate continuation of the downtrend. In addition, the perfect order of the three Exponential Moving Averages is still intact (the 25-day EMA is at the bottom and the the 200-day EMA is on top), while the RSI remains below its 50.00 level.
Pivot Points
According to Binary Tribune’s daily analysis, the central pivot point for the pair is at 1.1142. In case EUR/USD manages to breach the first resistance level at 1.1230, it will probably continue up to test 1.1301. In case the second key resistance is broken, the pair will probably attempt to advance to 1.1389.
If EUR/USD manages to breach the first key support at 1.1071, it will probably continue to slide and test 1.0983. With this second key support broken, the movement to the downside will probably continue to 1.0912.
The mid-Pivot levels for today are as follows: M1 – 1.0948, M2 – 1.1027, M3 – 1.1107, M4 – 1.1186, M5 – 1.1266, M6 – 1.1345.
In weekly terms, the central pivot point is at 1.1096. The three key resistance levels are as follows: R1 – 1.1276, R2 – 1.1393, R3 – 1.1573. The three key support levels are: S1 – 1.0979, S2 – 1.0799, S3 – 1.0682.