USD/CHF has been holding well above the 25-day (blue), the 50-day (red) and the 200-day (white) Exponential Moving Averages since February 27th, when the cross received support at the 50-day EMA. In early March the up move accelerated even more, with the Average Directional Index surging above its 50.00 level, which led to the cross marking a prominent high at 1.0131 on March 12th. On the following trading day (March 13th) the pair made an attempt to test that high, but it was unsuccessful, which bolstered the case that a trading range was probably at hand. A lower high at 1.0112 (the yellow line) was recorded, after which a rejection took place and the cross retreated to the downside, forming the lower portion of the range. On March 17th there was a breakout attempt from the lower boundary of the trading range, but it failed. On the next day, however, first, a breakout to the downside from a tight three-bar range occurred, followed by another test of the lower boundary of the larger range and, finally, a successful breakout below 1.0000 took place (the green line on the 4-hour chart below).
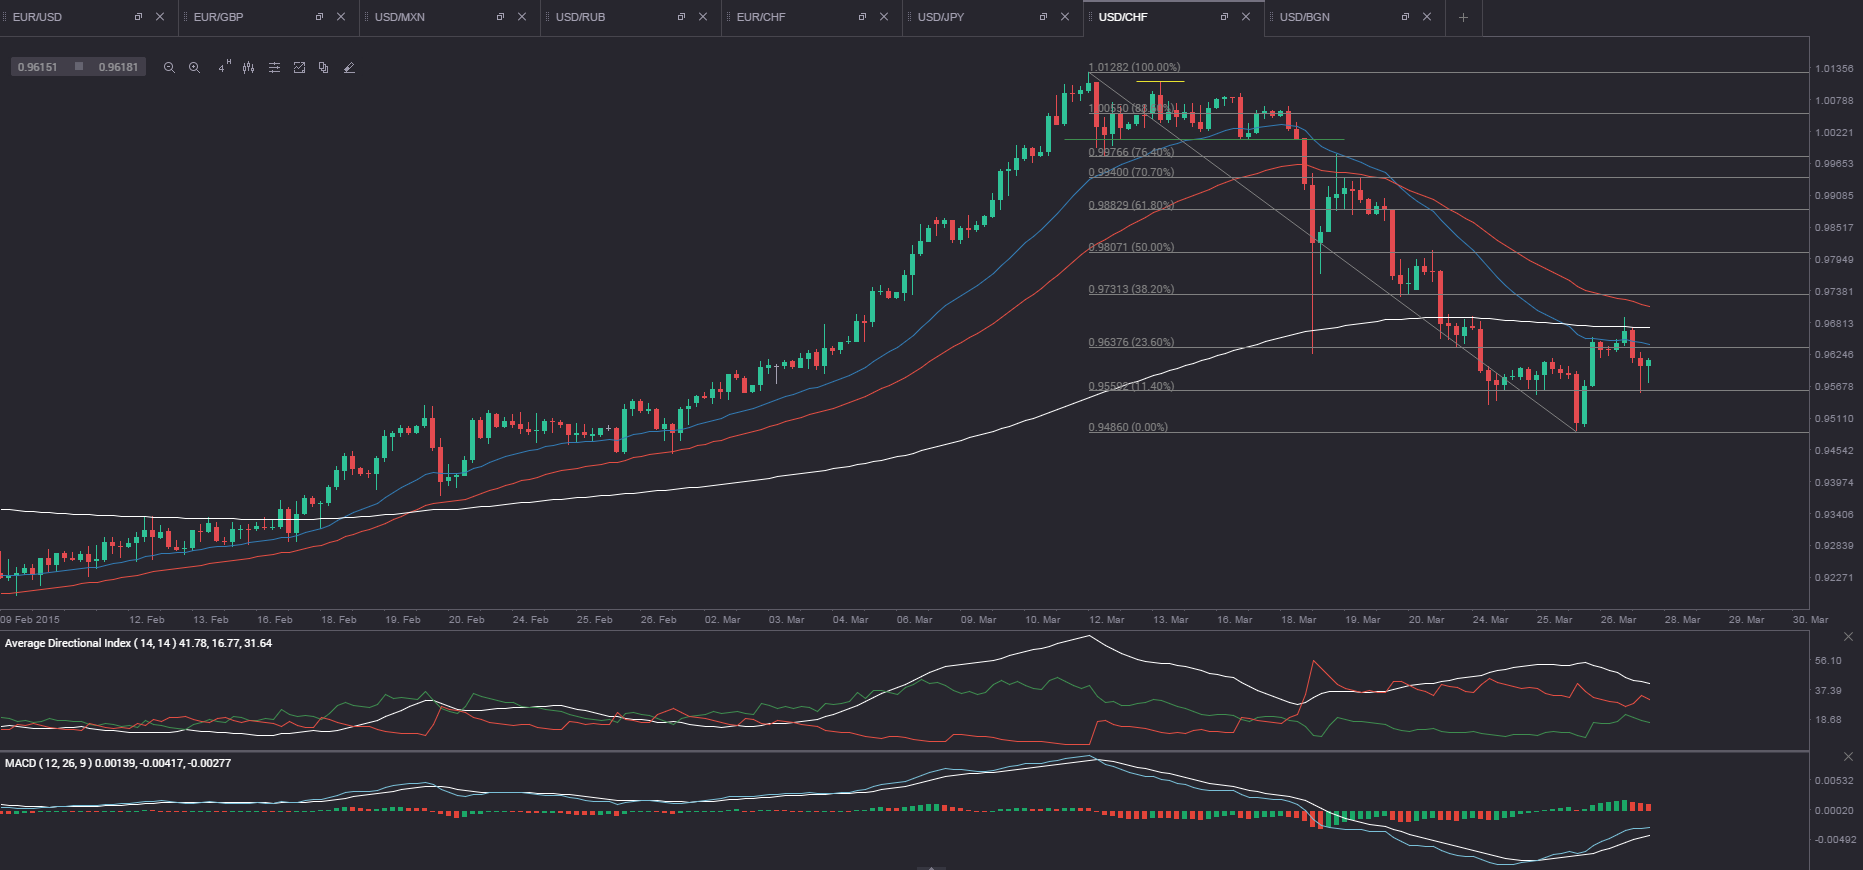
The large bear-trend bar with an extended lower wick reflected a drop to the first prominent low since early March at 0.9626, a move triggered by the Federal Reserves most recent policy decision to keep its benchmark rate on hold for a 49th consecutive meeting. This move also marked the first of the five ”bearish steps”, which followed all the way down to the most recent prominent low of 0.9484 on March 26th. A two-bar bullish reversal took place. Next, a second bullish spike drove the pair to the 25-day EMA, where it seemed to have encountered resistance. Another tight three-bar range followed, which suggested that a significant move was on the horizon. A breakout to the upside did occur and USD/CHF pierced the 25-day and the 200-day EMA on March 27th.
From this point on, USD/CHF may find resistance at the 38.2% Fibonacci level (0.9731). If the up move continues beyond it, we have a reason to expect that this move may be halted within the area between 38.2% and 61.8% Fibonacci levels. If, however, the pair goes beyond the 61.8% level, it is probably not retracing a portion of the prior down move, but making a new bullish one.
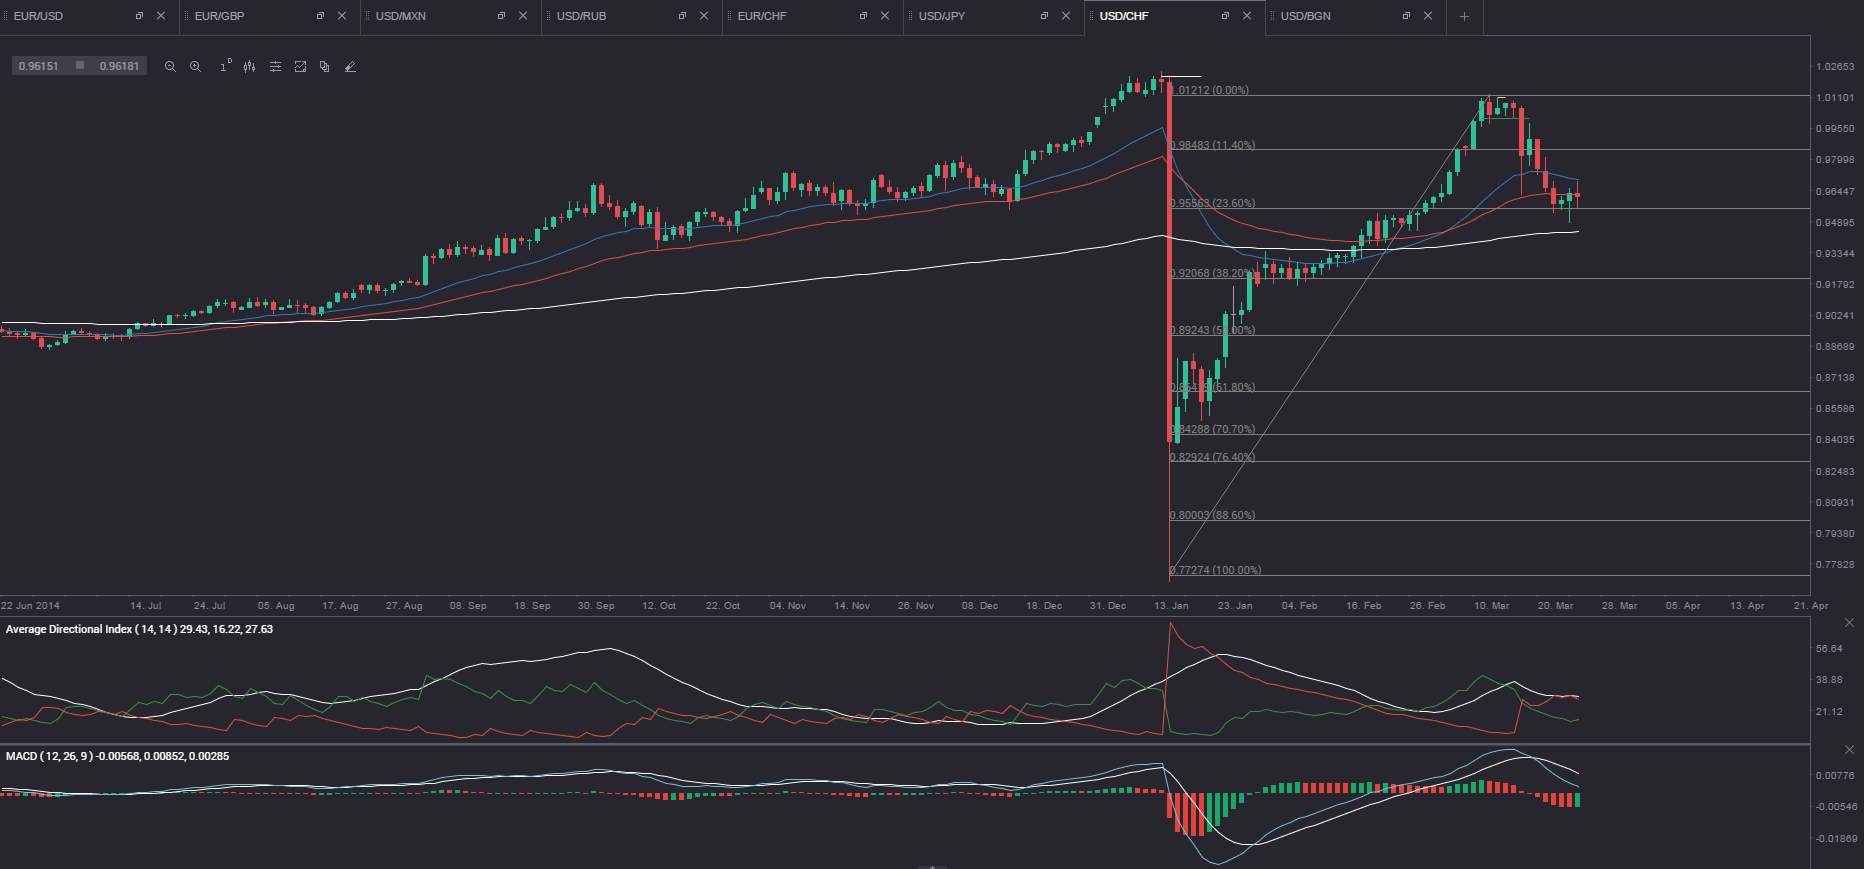
If we take a look at the larger time frame (the daily chart above), we can see that the above mentioned bearish move was a retracement to a significant up move. The retracement ended in the area between the 23.6% and the 38.2% Fibonacci levels. In addition, the three EMAs still remain in a ”perfect order” (the 25-day EMA is on top and the 200-day EMA is at the bottom), indicating the bullish move has a room to run. If taking into consideration the Average Directional Index, the DI+ (green) has been below the DI- (red) for some time and the gap between them is poised to be narrowed. At the same time, the ADX remains above its key 25.00 level. The March 26th bar represented a Hammer (bullish single-bar reversal pattern), which appeared close to a prior zone of support, thus, fueling the case of an up move. The next and last bar on the chart (March 27th) was a narrow-range one and its high was higher than that of the previous bar. In case we witness a break above the high of the March 27th narrow-range bar in the upcoming week, we have a reason to expect a considerable move up.
If the up move indeed continues, there is a chance that it may try to test the March 12th high at 1.0131. In case the latter is broken, USD/CHF may even attempt to test the next prominent high, which occurred on January 15th – 1.0221 (the white line on the daily chart).
The bullish move will certainly be bolstered, if a series of positive macroeconomic reports come out from the United States in the upcoming month, and especially if the Federal Reserve Bank introduces a rate hike at some of its upcoming policy meetings.