Yesterday’s trade saw USD/RUB within the range of 40.860-41.433. The pair closed at 41.380, gaining 1.04% on a daily basis.
At 8:24 GMT today USD/RUB was up 0.44% for the day to trade at 41.564. The pair broke the first key daily and the first key weekly resistance levels and touched a new all-time high at 41.600 at 7:11 GMT.
Fundamentals
United States
Initial, Continuing Jobless Claims
The number of people in the United States, who filed for unemployment assistance for the first time during the week ended on October 17th, probably rose to 282 000 from 264 000 in the prior week. The latter has been the lowest number of claims since April 15th 2000, when it was 259 000. The 4-week moving average, an indicator lacking seasonal effects, was 283 500, marking a decrease of 4 250 from the previous weeks unrevised average. This has been the lowest level for this average since June 10th 2000, when it was reported also at 283 500.
Initial jobless claims number is a short-term indicator, reflecting lay-offs in the country. In case the number of claims increased more than projected, this would have a bearish effect on the greenback.
The number of continuing jobless claims probably decreased to the seasonally adjusted 2 380 000 during the week ended on October 10th, from 2 389 000 in the previous week. The latter was an increase by 7 000 compared to the revised number of claims, reported during the week ended on September 26th. This indicator represents the actual number of people unemployed and currently receiving unemployment benefits, who filed for unemployment assistance at least two weeks ago.
The Department of Labor is to release the weekly report at 12:30 GMT.
Manufacturing PMI by Markit – preliminary estimate
Manufacturing activity in the United States probably slowed down in October, with the corresponding preliminary Purchasing Managers Index coming in at a reading of 57.0. In September the final seasonally adjusted PMI stood at 57.5, down from 57.9 in August, as the latter has been the highest index reading since April 2010.
According to Markit Economics, manufacturing production increased sharply in September, although the rate of expansion eased to a four-month low. Survey respondents widely commented on improving underlying economic conditions, alongside greater expenditure among clients in both domestic and export markets. There were also reports that successful new product launches and rising investment spending had boosted manufacturing workloads in September. Strong overall new business gains were supported by one of the fastest increases in new export orders, seen over the past three years. Higher levels of new work placed pressure on operating capacity at some manufacturing firms in September, as highlighted by a further robust increase in outstanding business volumes across the sector.
Values above the key level of 50.0 indicate optimism (expanding activity). Higher than expected PMI readings would certainly support the US dollar. The preliminary data by Markit is due out at 13:45 GMT.
Leading Economic Index by the CB
The Conference Board Leading Economic Index for the United States probably increased 0.6% in September compared to a month ago, acording to the median estimate by experts. In August compared to July the index gained 0.2%. It encompasses a variety of economic indicators, which signify possible changes in overall economic activity. The index is comprised by the following components: average weekly hours in manufacturing, average weekly initial claims for unemployment insurance, manufacturers’ new orders, consumer goods and materials, ISM Index of New Orders, manufacturers new orders, nondefense capital goods excluding aircraft orders, building permits, new private housing units, Stock prices, 500 common stocks, Leading Credit Index, interest rate spread, 10-year Treasury bonds less federal funds, average consumer expectations for business conditions. Better than expected performance of the index is usually dollar positive. The Conference Board will release the official data at 14:00 GMT.
Lower oil prices
The ruble lost ground against its major peers during European trade today, mostly due to falling prices of oil.
Pivot Points
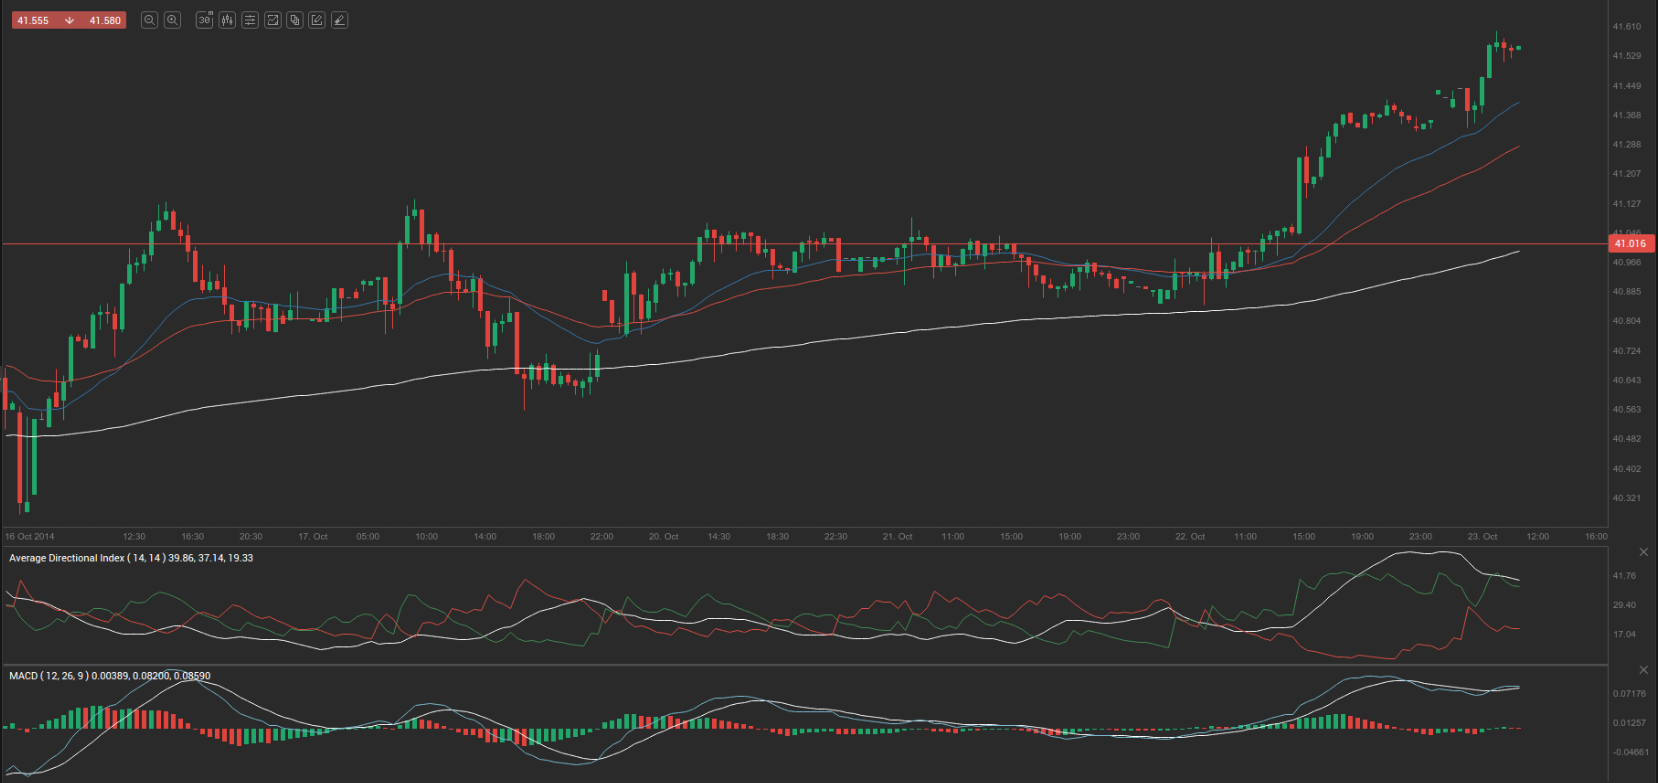
According to Binary Tribune’s daily analysis, the central pivot point for the pair is at 41.224. In case USD/RUB manages to breach the first resistance level at 41.589, it will probably continue up to test 41.797. In case the second key resistance is broken, the pair will probably attempt to advance to 42.162.
If USD/RUB manages to breach the first key support at 41.016, it will probably continue to slide and test 40.651. With this second key support broken, the movement to the downside will probably continue to 40.443.
The mid-Pivot levels for today are as follows: M1 – 40.547, M2 – 40.834, M3 – 41.120, M4 – 41.407, M5 – 41.693, M6 – 41.980.
In weekly terms, the central pivot point is at 40.706. The three key resistance levels are as follows: R1 – 41.212, R2 – 41.675, R3 – 42.181. The three key support levels are: S1 – 40.243, S2 – 39.737, S3 – 39.274.