Yesterday’s trade saw USD/JPY within the range of 106.76-107.41. The pair closed at 106.95, losing 0.20% on a daily basis.
At 8:00 GMT today USD/JPY was down 0.36% for the day to trade at 106.56. The pair broke the first and the second key daily supports and touched a daily low at 106.25 at 6:25 GMT.
Fundamentals
United States
The index of existing home sales in the United States probably gained 1.0% to a level of 5.10 million in September compared to August. In August compared to July existing home sales dropped 1.8% to 5.05 million. Julys level of 5.140 million has been the highest since September 2013.
The sample of data encompasses condos, co-ops and single-family houses.
Statistical data on existing home sales is often used along with statistical figures regarding the new home sales and pending home sales, with the major objective being to draw a conclusion how nation’s housing sector is performing, regardless of interest rates. The most active house-purchasing period in the United States is usually between the months of March through June. Therefore, in case statistical data revealed a sudden drop in the number of homes sold rather than an improvement during this period, this would be considered as a signal of weakness in country’s housing market.
The report on existing home sales usually does not cause a real direct impact on US economy. Actually, this effect appears to be minimal, due to the fact that nothing is produced with the mere sale of an existing home. In terms of economic activity, the sale of an existing house may be related only to interior design and purchases of new furniture.
The reason markets pay a certain attention to existing home sales report is that it reveals much about the general course of nation’s economy. A major part of the population considers a house as a sign of wealth and, unlike the money wealth, which is concentrated in certain regions of the country and held by the wealthiest representatives of the population, ”housing wealth” is evenly distributed across the country.
In case the index increased more than anticipated, this would have a bullish effect on the US dollar. The National Association of Realtors (NAR) is to release the official figure at 14:00 GMT.
Japan
The deficit on Japanese merchandise trade balance probably narrowed to 0.777 trillion JPY during September, acording to the median forecast by experts, from a deficit of 0.948 trillion JPY, registered in August. Total exports dropped at an annualized rate of 1.3% to 5.782 trillion JPY in August, with shipments to Asia, which account for over half of Japans overall exports, falling 0.6%. Within this category, the largest declines in exports were reported for Indonesia (14.8%), Hong Kong (1.6%) and China (0.2%). Sales to the United States decreased 4.4% in August. Total imports fell at an annualized rate of 1.5% to reach 6.753 trillion JPY in August. Inward shipments of mineral fuels, which account for almost 33% of nations total imports, declined 2.6%.
During the period 1970-2010 Japan has had regular annual trade surpluses. Since 2011, on the other hand, the country has been recording trade deficits, because yen depreciation led to higher costs of imports, while increased purchases of fossil fuels and gas were aimed to neutralize the loss of nuclear power after the devastating earthquake and the tsunami in March 2011.
The merchandise trade balance, as an indicator, measures the difference in value between the country’s exported and imported goods during the reported period. A positive balance signifies a trade surplus and a negative balance signifies a trade deficit. The balance of trade reflects the net export of goods, or one of the components to form country’s Gross Domestic Product. Generally, exports reflect economic growth, while imports indicate domestic demand. In case the trade balance deficit contracted more than projected, this would provide support to the yen. The Ministry of Finance will release the official trade data at 23:50 GMT.
Pivot Points
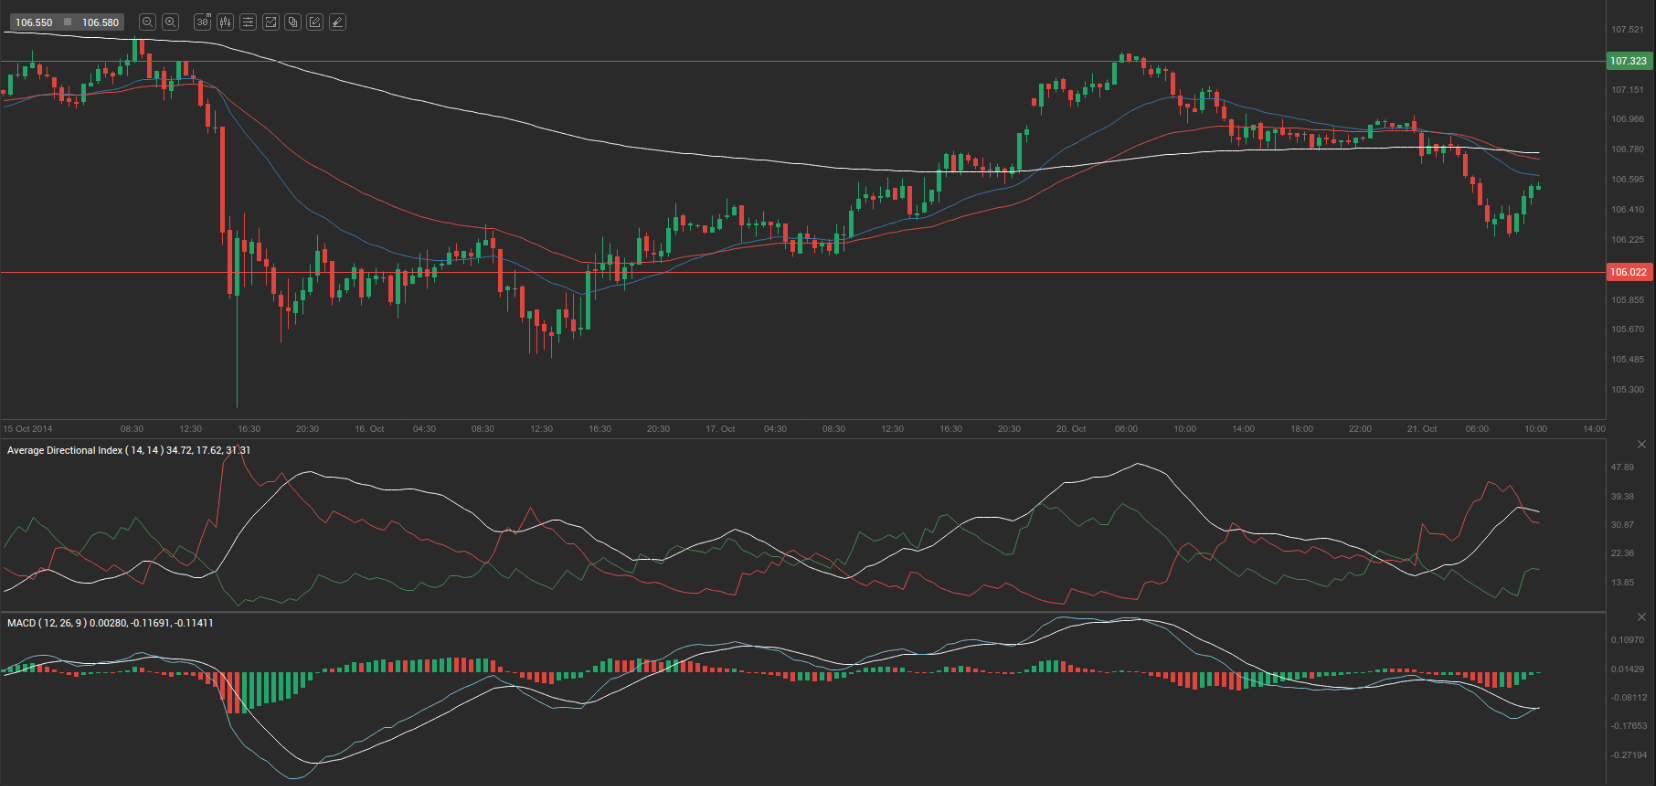
According to Binary Tribune’s daily analysis, the central pivot point for the pair is at 107.04. In case USD/JPY manages to breach the first resistance level at 107.32, it will probably continue up to test 107.69. In case the second key resistance is broken, the pair will probably attempt to advance to 107.97.
If USD/JPY manages to breach the first key support at 106.67, it will probably continue to slide and test 106.39. With this second key support broken, the movement to the downside will probably continue to 106.02.
The mid-Pivot levels for today are as follows: M1 – 106.21, M2 – 106.53, M3 – 106.86, M4 – 107.18, M5 – 107.51, M6 – 107.83.
In weekly terms, the central pivot point is at 106.56. The three key resistance levels are as follows: R1 – 107.94, R2 – 109.00, R3 – 110.38. The three key support levels are: S1 – 105.50, S2 – 104.12, S3 – 103.06.