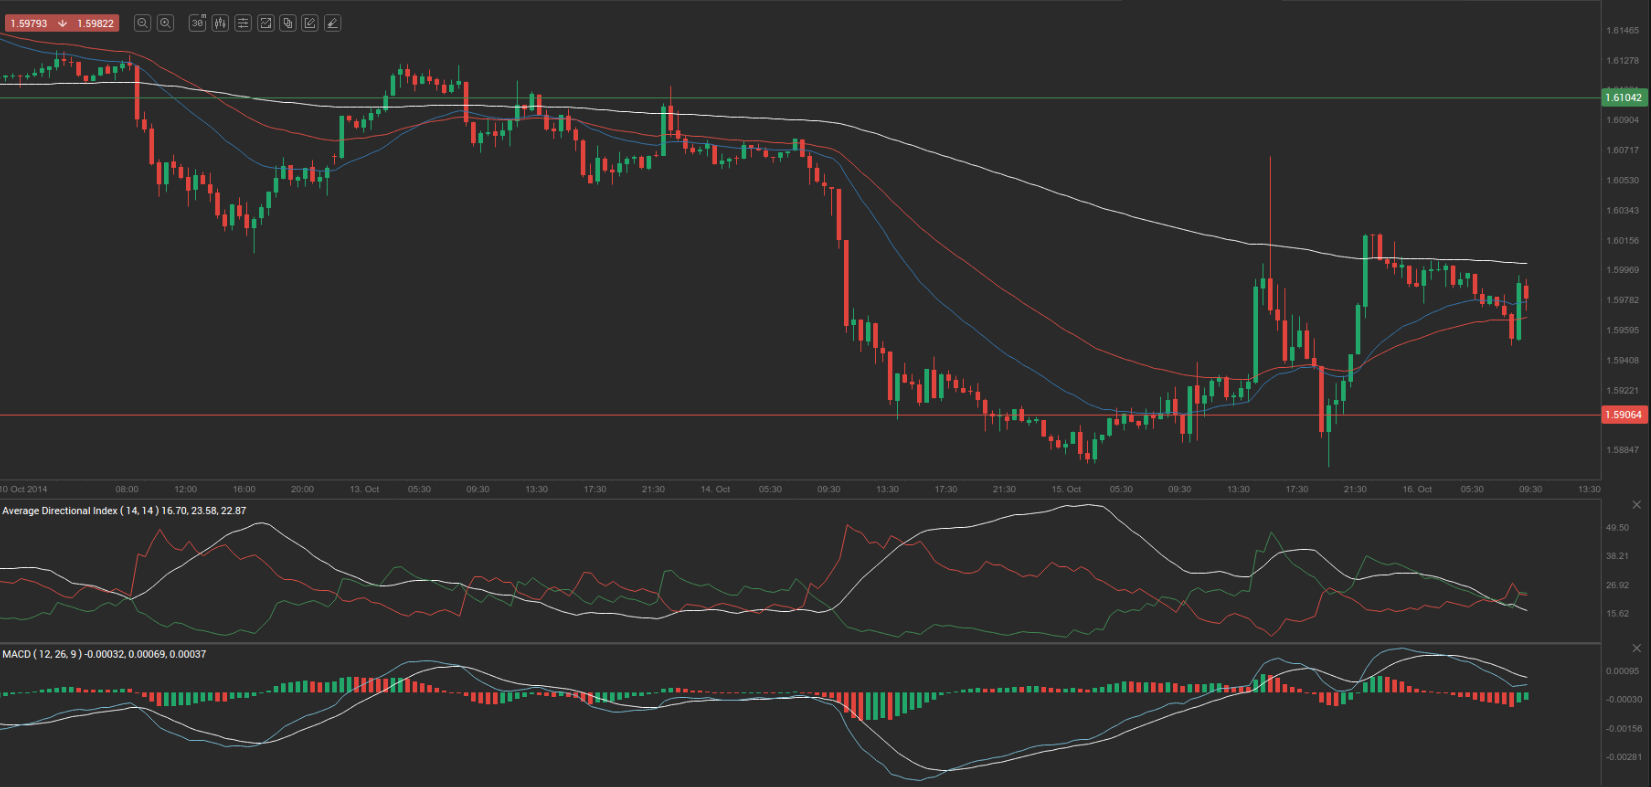
Yesterday’s trade saw GBP/USD within the range of 1.5873-1.6071. The pair closed at 1.6021, gaining 0.74% on a daily basis.
At 7:20 GMT today GBP/USD was down 0.18% for the day to trade at 1.5990. The pair touched a daily low at 1.5951 at 6:25 GMT.
Fundamentals
UBS rate forecast
Yesterday it became clear that UBS revised its forecast regarding the first rate hike by Bank of England from the current record low level of 0.50%. Analysts from the Swiss institution project that a hike may be introduced in August 2015.
“It has become increasingly clear that there has been a change in the outlook” in the past few months, said UBS AG economists including David Tinsley in London, as reported by Bloomberg. “Both external risks and internal ones have the potential for the U.K. to experience a more significant slowdown in activity than in the MPC’s central case.”
Bank of England maintained its benchmark rate at the record low level in October, but, however, two out of nine members of the Monetary Policy Committee already voted in favor of a rate increase in July and August.
United States
Initial, Continuing jobless claims
The number of people in the United States, who filed for unemployment assistance for the first time during the week ended on October 10th, probably rose to 290 000 from 287 000 in the prior week. The 4-week moving average, an indicator lacking seasonal effects, was 287 750, marking a decrease of 7 250 from the previous weeks revised average. This has been the lowest level for this average since early February 2006, when it was reported at 286 500. The previous weeks average was revised up by 250 from 294 750 to 295 000.
Initial jobless claims number is a short-term indicator, reflecting lay-offs in the country. In case the number of claims increased more than projected, this would have a bearish effect on the greenback.
The number of continuing jobless claims probably decreased to the seasonally adjusted 2 380 000 during the week ended on October 3rd, from 2 381 000 in the previous week. The latter was a decrease by 1 000 compared to the revised number of claims, reported during the week ended on September 19th. It has also been the lowest level for insured unemployment since May 27th 2006. This indicator represents the actual number of people unemployed and currently receiving unemployment benefits, who filed for unemployment assistance at least two weeks ago.
The Department of Labor is to release the weekly report at 12:30 GMT.
Industrial output and Capacity Utilization Rate
Industrial output in the United States probably expanded 0.4% in September compared to August, following a 0.1% drop in August compared to July. Augusts has been the first fall since January this year, fueled by lower production of motor vehicles. In August production of motor vehicles and parts shrank 7.6%, which followed an increase by over 9% in July. In annual terms, production rose 4.10% in August and 4.12% in July.
The index of industrial production reflects the change in overall inflation-adjusted value of output in sectors such as manufacturing, mining and utilities in the United States. The index is sensitive to consumer demand and interest rates. As such, industrial production is an important tool for future GDP and economic performance forecasts. Those figures are also used to measure inflation by central banks as very high levels of industrial production may lead to uncontrolled levels of consumption and rapid inflation. It is a coincident indicator, which means that changes in its levels generally echo similar shifts in overall economic activity. Any increase in the index usually boosts demand for the US dollar.
The Board of Governors of the Federal Reserve is to release the production data at 13:15 GMT.
In addition, Capacity Utilization Rate in the country probably increased to 79.0% in September from 78.8% in August. This indicator represents the optimal rate for a stable production process, or the highest possible level of production in an enterprise, in case it operates within a realistic work schedule and has sufficient raw materials and inventories at its disposal. High rates of capacity utilization usually lead to inflationary pressure. In general, higher rates tend to be dollar positive.
Philadelphia Fed Manufacturing data
The Philadelphia Fed Manufacturing Index probably fell to a reading of 20.0 in October from 22.5 index points during the previous month. In August the index was reported at 28.0, or the highest level since March 2011. The index is based on a monthly business survey (the Business Outlook Survey), measuring manufacturing activity in the third district of the Federal Reserve, Philadelphia. Participants give their opinion about the direction of business changes in overall economy and different indicators of activity in their own companies, such as employment, working hours, new and existing orders, deliveries, inventories, delivery time, price etc. The survey is conducted every month since May 1968. The results are presented as the difference between the percentages of positive and negative projections. A level above zero is indicative of improving conditions, while a level below zero is indicative of worsening conditions. The Federal Reserve Bank of Philadelphia is expected to release the official results from the survey at 14:00 GMT. Lower-than-expected index readings would have a bearish effect on the greenback.
NAHB Housing Market Index
The National Association of Home Builders (NAHB) Housing Market Index probably remained unchanged at a reading of 59.0 in October. It is based on a monthly survey in regard to current home sales and expected sales in the coming six months. Values above the key level of 50.0 indicate that housing market conditions are good. Therefore, higher than projected readings would provide support to the US dollar. The official data is scheduled for release at 14:00 GMT.
Pivot Points
According to Binary Tribune’s daily analysis, the central pivot point for the pair is at 1.5988. In case GBP/USD manages to breach the first resistance level at 1.6104, it will probably continue up to test 1.6186. In case the second key resistance is broken, the pair will probably attempt to advance to 1.6302.
If GBP/USD manages to breach the first key support at 1.5906, it will probably continue to slide and test 1.5790. With this second key support broken, the movement to the downside will probably continue to 1.5708.
The mid-Pivot levels for today are as follows: M1 – 1.5749, M2 – 1.5848, M3 – 1.5947, M4 – 1.6046, M5 – 1.6145, M6 – 1.6244.
In weekly terms, the central pivot point is at 1.6082. The three key resistance levels are as follows: R1 – 1.6224, R2 – 1.6369, R3 – 1.6511. The three key support levels are: S1 – 1.5937, S2 – 1.5795, S3 – 1.5650.