Yesterday’s trade saw EUR/SEK within the range of 9.1517-9.2265. The pair closed at 9.1853, gaining 0.06% on a daily basis.
At 6:19 GMT today EUR/SEK was down 0.02% for the day to trade at 9.1881. The pair touched a daily low at 9.1829 at 6:07 GMT.
Fundamentals
Euro zoneItalian balance of trade
Italy probably had a surplus of 3.24 billion EUR on its trade balance in August, according to market expectations. Nations trade surplus expanded to 6.85 billion EUR in July this year, compared with a surplus figure of 5.98 billion EUR in July 2013, supported by shipments to the United States and the Euro region. Julys surplus figure is the largest on record. Total exports increased at an annualized rate of 1.1% to reach 38.55 billion EUR in July. Total imports dropped 1.4% to 31.69 billion EUR. The United States (18.4%), Czech Republic (16.4%) and Spain (10.8%) were the most dynamic markets for exports, according to data by Istat. At the same time, purchases from the OPEC countries (30.2%) and the Russian Federation (27.2%) dropped the most.
In case Italys trade surplus shrank more than expected, this might have a limited bearish effect on the single currency. The National Institute of Statistics (Istat) is to release the official trade data at 8:00 GMT.
Euro zone balance of trade
The surplus on Euro areas trade balance probably contracted to 9.0 billion EUR in August, according to the median forecast by experts, following a surplus figure of 21.2 billion EUR in July. In July 2013 the trade surplus was at the amount of 18.0 billion EUR. Total exports climbed at an annualized pace of 3% to 141.7 billion EUR in July, while imports rose 1% to reach 138.8 billion EUR.
The surplus on regions extra-EU28 trade balance amounted to 1.7 billion EUR in July this year compared to a surplus of 10.8 billion EUR in July 2013. The largest increases in EU28 exports were registered with China (a 10% gain during the period January-June 2014 compared to January-June 2013) and South Korea (an 8% gain). As for EU28 imports the highest increases were observed with South Korea (11%), Turkey (7%), China and Switzerland (both 5%).
Euro zones balance of trade produces regular surpluses mainly due to the high export of manufactured goods, such as machinery and vehicles. At the same time, the region is a net importer of energy and raw materials. Member states such as Germany, Italy, France and Netherlands play a key role in total trade.
The trade balance, as an indicator, measures the difference in value between region’s exported and imported goods and services during the reported period. It reflects the net export of goods and services, or one of the components to form the Gross Domestic Product. Generally, exports reflect economic growth, while imports indicate domestic demand. In case the trade balance surplus contracted more than anticipated in August, this would certainly have a bearish impact on the euro. Eurostat is to publish the official trade data at 9:00 GMT.
Euro zone harmonized CPI – final estimate
The annualized final consumer price index in the Euro zone, evaluated in accordance with Eurostat’s harmonized methodology, probably confirmed the preliminary estimate of 0.3% in September, according to the median forecast by experts. If confirmed, this would be the lowest level of the HICP since October 2009. In August the HICP has been revised up to 0.4%, up from a preliminary estimate of 0.3%. In September services is expected to have the highest annual rate among the components of the index (1.1%, compared to 1.3% in August), followed by food, alcohol and tobacco (0.2%, compared to -0.3% in August), non-energy industrial goods (0.1%, compared to 0.3% in the prior month) and energy (-2.4%, compared to -2.0% in August).
The index shows the change in price levels of a basket of goods and services from consumer’s perspective and also reflects purchasing trends. The main components of the HICP are food, alcohol and tobacco (accounting for 19% of the total weight), energy (11%), non-energy industrial goods (29%) and services (41%).
The HICP is used to evaluate and compare inflation rates between Member States, according to Art. 121 of the Amsterdam’s Agreement and directives by the European Central Bank (ECB), in order the latter to achieve price stability and the implementation of monetary policy. The HICP aggregates are calculated as a weighted average of each member state’s HICP components.
In case the HICP slowed down more than anticipated, thus, distancing from the 2% inflation objective set by the ECB, this would mount selling pressure on the euro, because of the greater possibility of introducing additional monetary policy measures in order to stimulate economic activity.
The annualized final Core HICP for September probably also matched the preliminary reading of 0.8%, reported on September 30th. In August the annualized core inflation was reported at 0.9%. This index excludes volatile categories such as food, energy, alcohol and tobacco. Eurostat is scheduled to release the official inflation data at 9:00 GMT.
Sweden
The rate of unemployment in Sweden probably increased to 7.5% during September, according to expectations, from 7.4% in the preceding month. The latter has been the lowest unemployment rate since December 2013. This indicator represents the percentage of the eligible work force that is unemployed, but is actively seeking employment. The rate of unemployment also reflects overall economic state in the country, as there is a strong correlation between consumer spending levels and labor market conditions. Low rates of unemployment are accompanied by increased spending, which causes a favorable effect on corporate profits and also leads to overall growth acceleration. However, in case the rate of unemployment increased more than expected, this would mount selling pressure on the krone. Statistics Sweden is to announce the official rate at 7:30 GMT.
Pivot Points
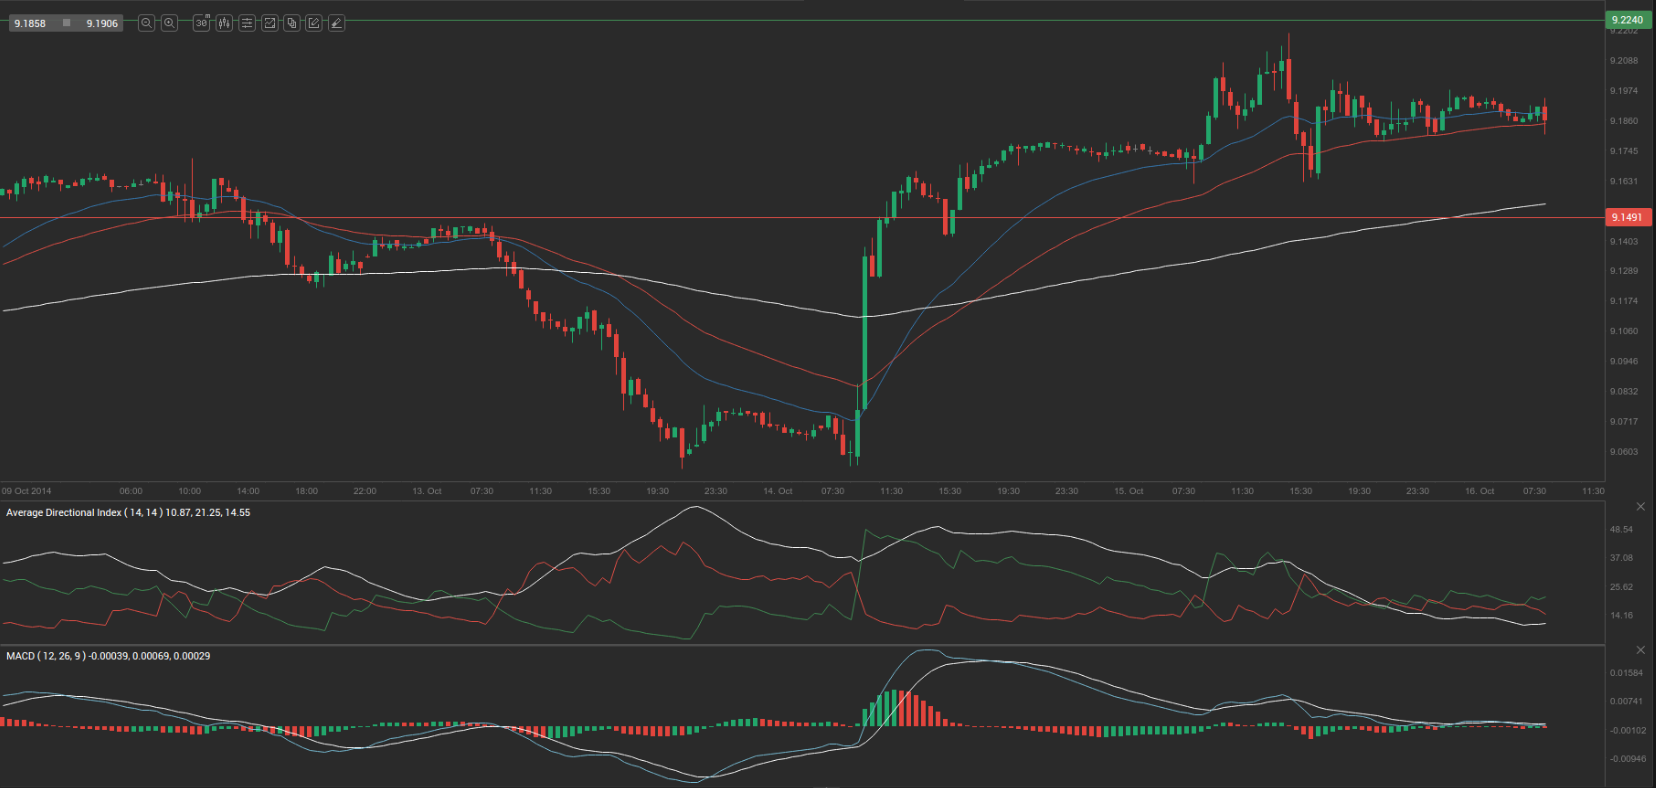
According to Binary Tribune’s daily analysis, the central pivot point for the pair is at 9.1878. In case EUR/SEK manages to breach the first resistance level at 9.2240, it will probably continue up to test 9.2626. In case the second key resistance is broken, the pair will probably attempt to advance to 9.2988.
If EUR/SEK manages to breach the first key support at 9.1491, it will probably continue to slide and test 9.1130. With this second key support broken, the movement to the downside will probably continue to 9.0744.
The mid-Pivot levels for today are as follows: M1 – 9.0937, M2 – 9.1311, M3 – 9.1685, M4 – 9.2059, M5 – 9.2433, M6 – 9.2807.
In weekly terms, the central pivot point is at 9.1203. The three key resistance levels are as follows: R1 – 9.1902, R2 – 9.2482, R3 – 9.3181. The three key support levels are: S1 – 9.0623, S2 – 8.9924, S3 – 8.9344.