Yesterday’s trade saw GBP/USD within the range of 1.6160-1.6253. The pair closed at 1.6186, losing 0.17% on a daily basis.
At 7:18 GMT today GBP/USD was up 0.02% for the day to trade at 1.6188. The pair broke the first key resistance and touched a daily high at 1.6251 at 3:15 GMT.
Fundamental view
United Kingdom
Activity in United Kingdom’s sector of construction probably slowed down in September, with the corresponding PMI coming in at 63.5, down from 64.0 in August. The index is based on a survey, encompassing managers of companies, operating in construction sector. They are asked about their estimate regarding current business conditions (new orders, output, employment, demand in the future). Values above the key level of 50.0 signify that activity in the sector has expanded. Lower than projected readings would certainly trigger a sell-off in the pound. The Chartered Institute of Purchasing and Supply (CIPS) is to announce the official reading at 8:30 GMT.
Yesterday it became clear that manufacturing activity in the UK reached lows unseen in 17 months. The manufacturing Purchasing Managers Index in the country plunged to a reading of 51.6 in September from 52.5 in August, as reported by Markit and the Chartered Institute of Purchasing and Supply. Following the release of this report, GBP/USD tumbled to a daily low at 1.6162, or the lowest level since September 16th.
United States
Initial, Continuing Jobless Claims
The number of people in the United States, who filed for unemployment assistance for the first time during the week ended on September 26th, probably rose to 297 000 from 293 000 in the prior week. The 4-week moving average, an indicator lacking seasonal effects, was reported at 298 500, or a decrease by 1 250 from the previous weeks revised average. The prior weeks average was revised up by 250 from 299 500 to 299 750.
In the week ended on September 12th the number of claims reached 280 000, or the lowest in eight weeks.
Initial jobless claims number is a short-term indicator, reflecting lay-offs in the country. In case the number of claims increased more than projected, this would have a bearish effect on the greenback.
The number of continuing jobless claims probably decreased to the seasonally adjusted 2 438 000 during the week ended on September 19th, from 2 439 000 in the previous week. The latter was an increase by 7 000 compared to the revised number of claims, reported during the week ended on September 5th. This indicator represents the actual number of people unemployed and currently receiving unemployment benefits, who filed for unemployment assistance at least two weeks ago.
The Department of Labor is to release the weekly report at 12:30 GMT.
Factory Orders
Factory orders in the United States probably dropped 9.0% in August compared to July, following a surge by 10.5% in the prior month, or the largest monthly increase on record, supported by an increase in transportation equipment. Excluding the sector of transportation, factory orders dropped 0.8% in July. This indicator presents the total value of new purchase orders, placed at manufacturers for durable and non-durable goods, and can provide insight into inflation and growth in US manufacturing sector. In case new orders dropped more than anticipated, this would have a bearish effect on the greenback. US Census Bureau will release the official data at 14:00 GMT.
Technical view
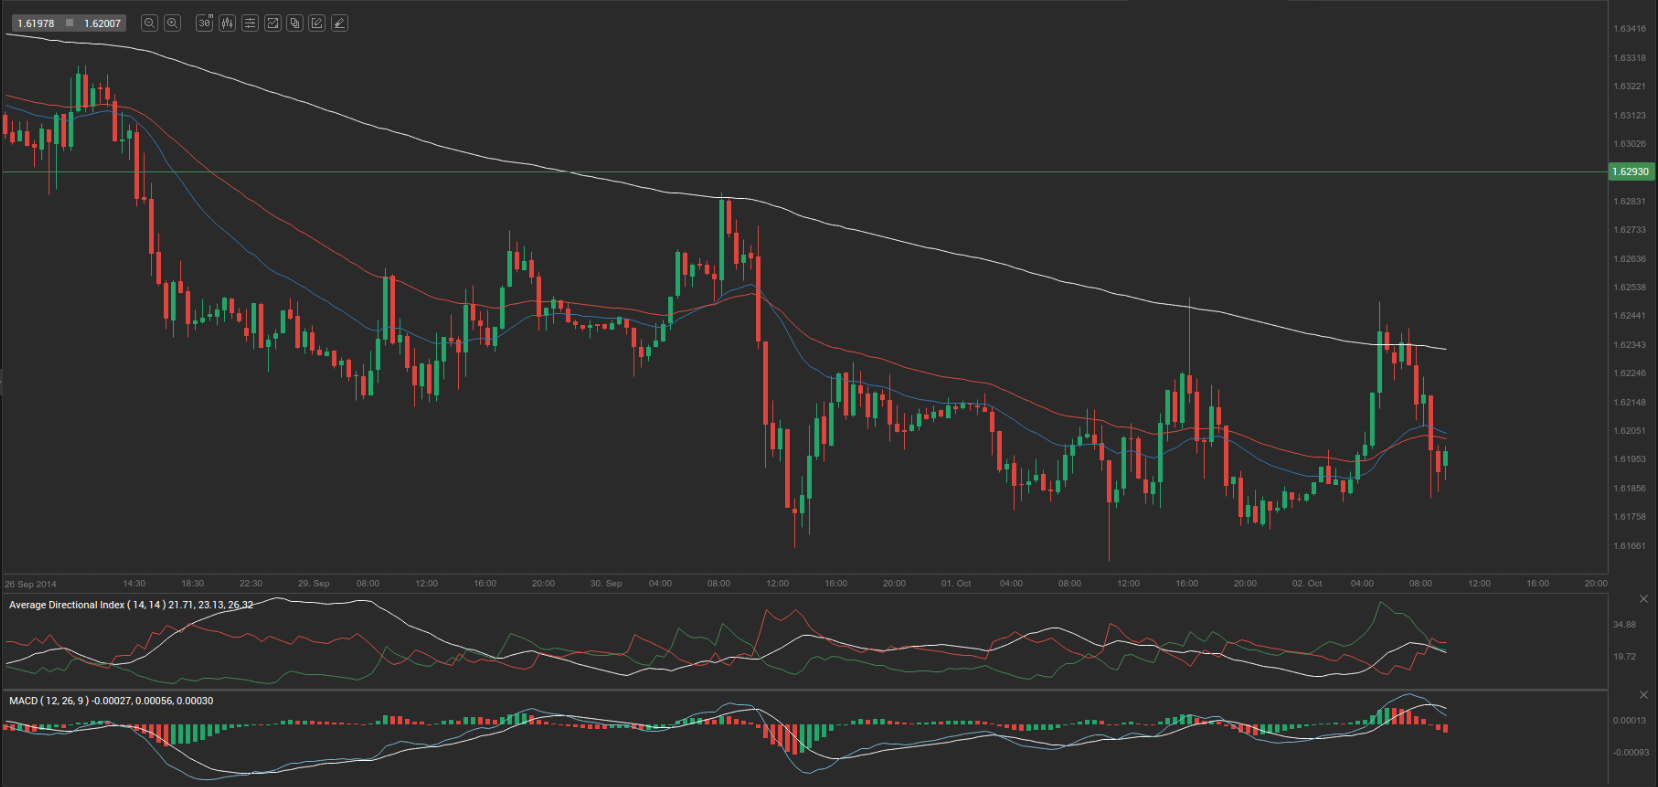
According to Binary Tribune’s daily analysis, the central pivot point for the pair is at 1.6200. In case GBP/USD manages to breach the first resistance level at 1.6239, it will probably continue up to test 1.6293. In case the second key resistance is broken, the pair will probably attempt to advance to 1.6332.
If GBP/USD manages to breach the first key support at 1.6146, it will probably continue to slide and test 1.6107. With this second key support broken, the movement to the downside will probably continue to 1.6053.
The mid-Pivot levels for today are as follows: M1 – 1.6080, M2 – 1.6127, M3 – 1.6173, M4 – 1.6220, M5 – 1.6266, M6 – 1.6313.
In weekly terms, the central pivot point is at 1.6300. The three key resistance levels are as follows: R1 – 1.6364, R2 – 1.6482, R3 – 1.6546. The three key support levels are: S1 – 1.6182, S2 – 1.6118, S3 – 1.6000.