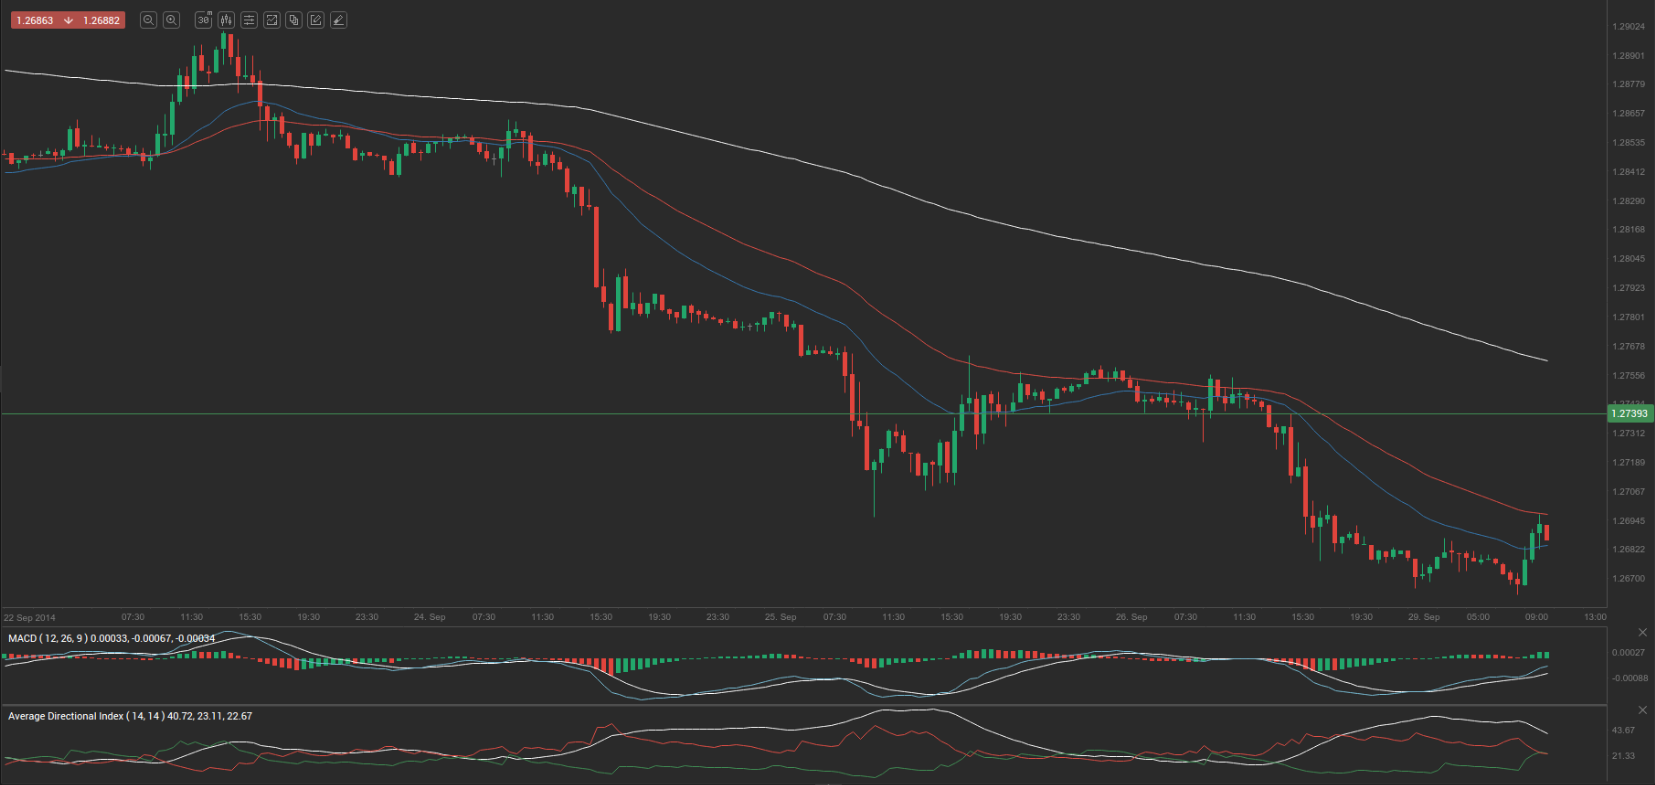
Friday’s trade saw EUR/USD within the range of 1.2675-1.2761. The pair closed at 1.2685, losing 0.52% on a daily basis.
At 7:28 GMT today EUR/USD was up 0.09% for the day to trade at 1.2696. The pair touched a daily high at 1.2698 at 7:27 GMT.
Fundamental view
Euro zone
Euro zone final Economic Sentiment Indicator
Confidence among consumers in the Euro area probably worsened in September. The final Consumer Economic Sentiment Indicator (ESI) probably confirmed the preliminary reading of -11.4 for the current month, which was reported on September 22nd. The index came in at -10 in August. The ESI reflects the level of optimism, which consumers have about economic development. The survey is conducted by phone and includes 23 000 households in the Euro zone. The questions asked stress on current economic and financial situation, savings intention and also on expected developments regarding consumer price indexes, general economic situation and major purchases of durable goods. The indicator measures consumer confidence on a scale of -100 to +100. A reading of -100 suggests a lack of confidence, zero means neutrality and a reading of +100 indicates extreme levels of confidence. Lower confidence usually implies lesser willingness to spend, including large-ticket purchases, while consumer spending is a key factor behind economic growth. Therefore, in case the ESI fell more than anticipated, this would mount selling pressure on the euro. The European Commission is expected to release the final index reading at 9:00 GMT on Monday.
German Consumer Inflation
German preliminary annualized Consumer Price Index probably remained steady at 0.8% during the current month, according to market expectations. In August the final CPI confirmed the preliminary reading of 0.8%. Energy prices dropped at an annualized rate of 1.9% in August. Prices were down in particular for mineral oil products (–4.6%, of which heating oil: –5.0%; motor fuels: –4.4%). Prices of solid fuels dropped 2.5%, while costs of central and district heating were 1.5% lower in August compared to the same month a year earlier. Electricity costs, on the other hand, climbed 1.7%, according to Destatis. Food prices increased at a pace of 0.3% in August this year compared to August 2013.
The index presents a general picture of the price change in the country, while encompassing all household types, all regions and all goods and services demanded (food, clothing, automobiles, rental, repair and hairdressing services etc). The index is based on a basket of goods and services, which is regularly renewed, so that goods and services, purchased more often by consumers, are included in the present survey.
Nation’s preliminary annualized CPI, evaluated in accordance with the harmonized methodology, probably also remained steady at 0.8% in September. The harmonised index of consumer prices (HICP) increased by 0.8% in August this year over the same month in 2013, or for the fourth time this year, an inflation rate of under 1% was determined for the HICP.
The harmonised methodology is used for the sake of consumer inflation comparison in an international context (among member-states in the Euro region). In case the CPI came above expectations and approached the 2-percent inflation objective, set by the European Central Bank, this would provide support to the euro. Destatis is scheduled to publish the preliminary CPI data at 12:00 GMT.
United States
Personal Spending and Income
Personal spending in the United States probably rose 0.5% in August compared to a month ago, according to market expectations, while personal income was probably up 0.3%. Spending dropped 0.1% in July, which has been the first decline in six months. At the same time, personal income increased 0.2% (or 28.6 billion USD) in July, while disposable personal income (DPI) rose 17.7 billion USD (or 0.1%). Private wages and salaries increased 12.9 billion USD in July, in comparison with an increase of 25.6 billion USD in June. Higher than expected rates of increase imply good employment conditions and, therefore, are dollar positive. The Bureau of Economic Analysis is to publish the official figures at 12:30 GMT.
Pending Home Sales
The index of pending home sales in the United States probably decreased 0.6% during August compared to July, when sales rose 3.3%. In annual terms, pending home sales fell 2.1% in July, or the least since November 2013.
When a sales contract is accepted for a property, it is recorded as a pending home sale. As an indicator the index provides information on the number of future home sales, which are in the pipeline. It gathers data from real estate agents and brokers at the point of a sale of contract and is currently the most accurate indicator regarding US housing sector. It samples over 20% of the market. In addition, over 80% of pending house sales are converted to actual home sales within 2 or 3 months. Therefore, this index has a predictive value about actual home sales.
Although there are some cancellations, there are not enough for the data to be skewed one way or another. The base value of the index is equal to 100, while the base year is 2001, when there has been high activity in the US housing sector.
The National Association of Realtor’s (NAR) will release the official index reading at 14:00 GMT. In case pending home sales dropped more than anticipated, this would have a bearish effect on the greenback.
Technical view
According to Binary Tribune’s daily analysis, the central pivot point for the pair is at 1.2707. In case EUR/USD manages to breach the first resistance level at 1.2739, it will probably continue up to test 1.2793. In case the second key resistance is broken, the pair will probably attempt to advance to 1.2825.
If EUR/USD manages to breach the first key support at 1.2653, it will probably continue to slide and test 1.2621. With this second key support broken, the movement to the downside will probably continue to 1.2567.
The mid-Pivot levels for today are as follows: M1 – 1.2594, M2 – 1.2637, M3 – 1.2680, M4 – 1.2723, M5 – 1.2766, M6 – 1.2809.
In weekly terms, the central pivot point is at 1.2754. The three key resistance levels are as follows: R1 – 1.2833, R2 – 1.2981, R3 – 1.3060. The three key support levels are: S1 – 1.2606, S2 – 1.2527, S3 – 1.2379.