Yesterdays trade saw USD/MXN within the range of 13.1041 – 13.0610. The pair closed at 13.0870, losing 0.05% on a daily basis, having gained 0.52% last week.
At 11:37 GMT today USD/MXN was up 0.13% for the day to trade at 13.1014. The pair held in a daily range between 13.0691 and 13.1310.
Fundamental view
United States
The US Department of Commerce will release its revised preliminary reading on US GDP growth at 12:30 GMT. According to analysts’ projections, the world’s biggest economy probably expanded by 3.9% in the second quarter, compared to the initial reading of 4.0% and the first quarter’s 2.1% contraction.
The GDP represents the total monetary value of all goods and services produced by one nation over a specific period of time. What is more, it is the broadest indicator of a country’s economic activity. The report on GDP holds a lot of weight for traders, operating in the Foreign Exchange Market. It serves as evidence of growth in a productive economy, or as evidence of contraction in an unproductive one. As a result, currency traders will look for higher rates of growth as a sign that interest rates will follow the same direction. Higher interest rates will attract more investors, willing to purchase assets in the country, while, at the same time, this will increase demand for the national currency.
Separately, the Labor Department is expected to report that the number of people who filed for initial unemployment benefits in the week ended August 23rd rose to 300 000, up by 2 000 from the preceding period.
Additionally, the index of pending home sales in the United States probably rose 0.5% during July compared to June, when sales unexpectedly dropped by 1.1%..
When a sales contract is accepted for a property, it is recorded as a pending home sale. As an indicator, the index provides information on the number of future home sales, which are in the pipeline. It gathers data from real estate agents and brokers at the point of a sale of contract and is currently the most accurate indicator regarding US housing sector. It samples over 20% of the market. In addition, over 80% of pending house sales are converted to actual home sales within 2 or 3 months. Therefore, this index has a predictive value about actual home sales.
The National Association of Realtors (NAR) will release the official index value at 14:00 GMT. In case pending home sales increased more than anticipated, this would have a bullish effect on the greenback.
Mexico
Insituto Nacional de Estadistica Y Geografia reported yesterday that Mexicos trade deficit widened in July to $980 million, according to preliminary data. The reading trailed analysts projections for a deficit of $722 million from June’s surplus of $424 million. This was the first monthly trade deficit since January.
The trade balance reflects the difference in value between exported and imported goods during the respective period. A positive figure indicates that more goods and services have been exported than imported. Export demand has a direct link to demand for the national currency and also causes an impact on levels of production. An expanding surplus, or a narrowing deficit, are generally seen as bullish for the local currency, and vice versa.
Technical view
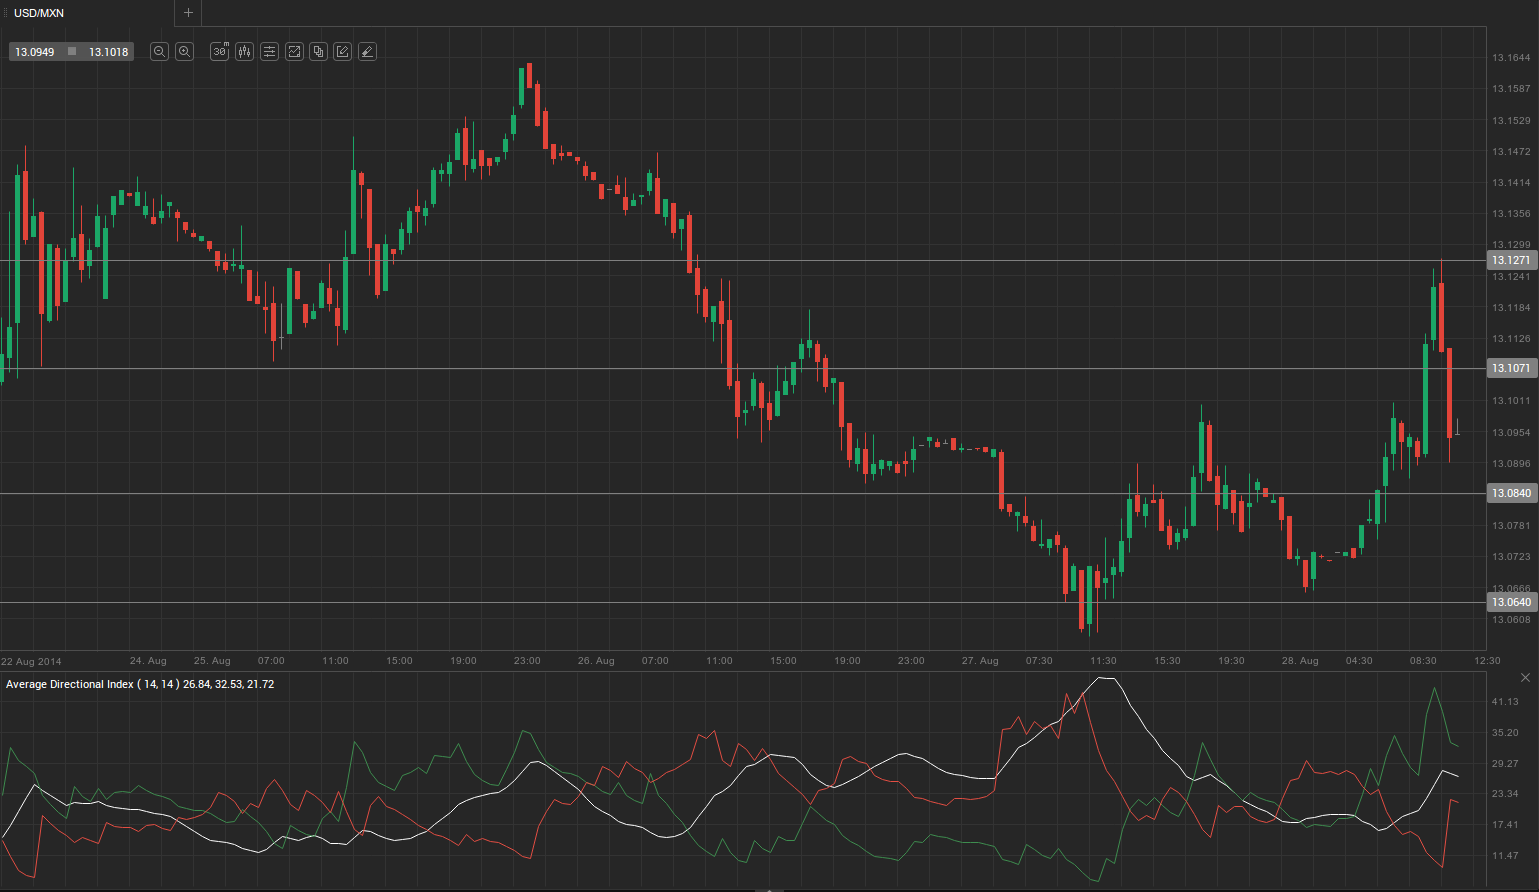
According to Binary Tribune’s daily analysis, the central pivot point for the pair is at 13.0840. In case USD/MXN manages to breach the first resistance level at 13.1071, it will probably continue up to test 13.1271. In case the second key resistance is broken, the pair will probably attempt to advance to 13.1502.
If USD/MXN manages to breach the first key support at 13.0640, it will probably continue to slide and test 13.0409. With this second key support broken, movement to the downside will probably continue to 13.0209.
The mid-Pivot levels for today are as follows: M1 – 13.0309, M2 – 13.0525, M3 – 13.0740, M4 – 13.0956, M5 – 13.1171, M6 – 13.1387.
In weekly terms, the central pivot point is at 13.1079. The three key resistance levels are as follows: R1 – 13.1803, R2 – 13.2235, R3 – 13.2959. The three key support levels are: S1 – 13.0647, S2 – 12.9923, S3 – 12.9491.