Friday’s trade saw AUD/USD within the range of 0.9298-0.9334. The pair closed at 0.9320, gaining 0.06% on a daily basis.
At 8:50 GMT today AUD/USD was down 0.06% for the day to trade at 0.9314. The pair touched a daily low at 0.9309 at 1:35 GMT.
Fundamental view
United States
The National Association of Home Builders (NAHB) Housing Market Index probably remained unchanged at a reading of 53.0 in August. It is based on a monthly survey in regard to current home sales and expected sales in the coming six months. Values above the key level of 50.0 indicate that housing market conditions are good. Therefore, higher than projected readings would provide support to the US dollar. The official data is scheduled for release at 14:00 GMT.
Technical view
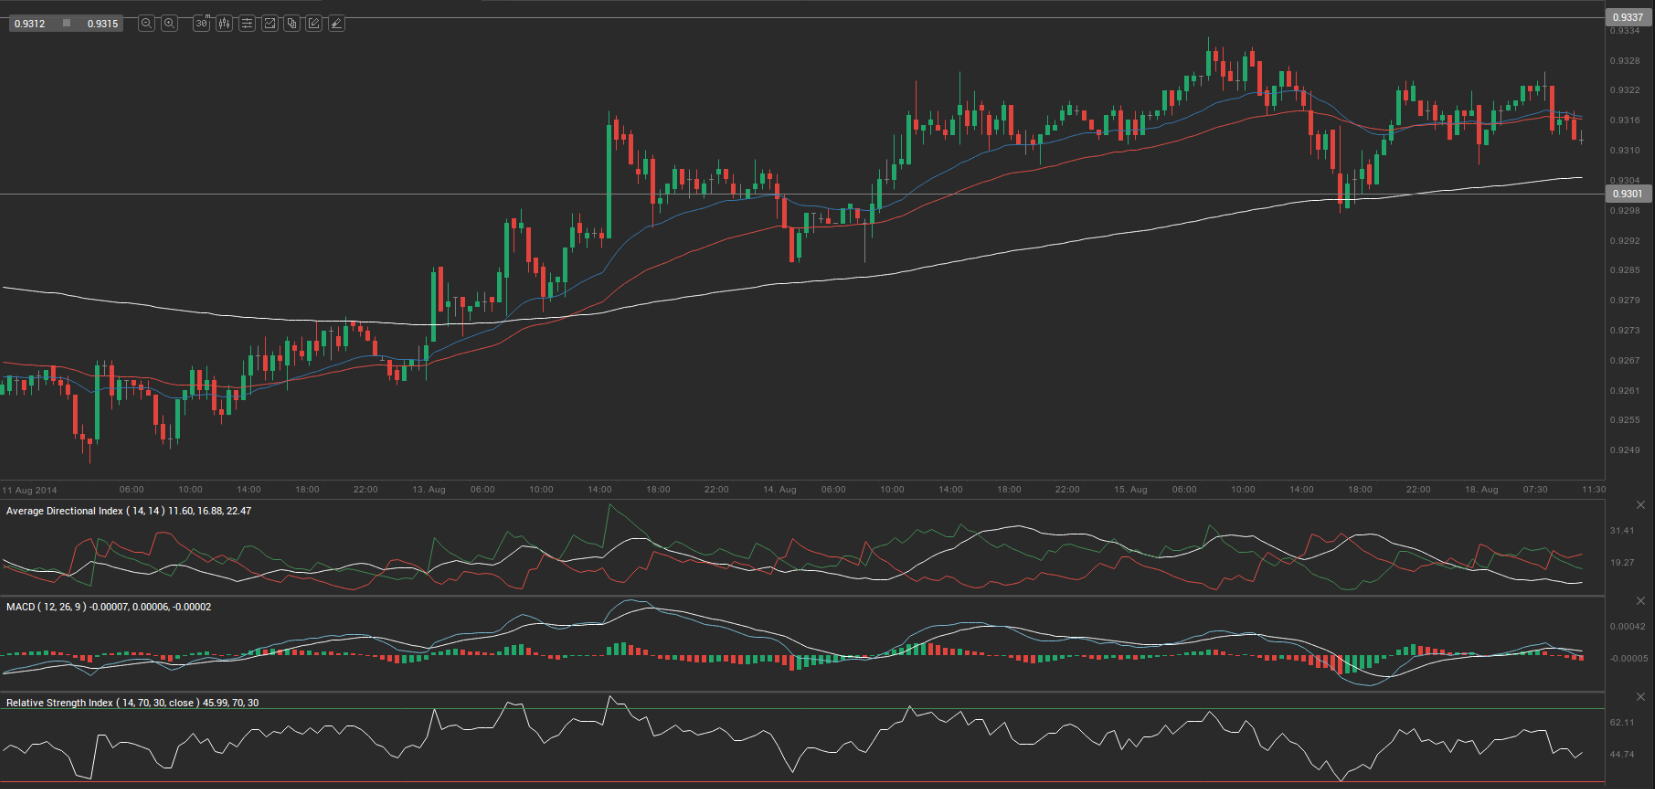
According to Binary Tribune’s daily analysis, the central pivot point for the pair is at 0.9317. In case AUD/USD manages to breach the first resistance level at 0.9337, it will probably continue up to test 0.9353. In case the second key resistance is broken, the pair will probably attempt to advance to 0.9373.
If AUD/USD manages to breach the first key support at 0.9301, it will probably continue to slide and test 0.9281. With this second key support broken, the movement to the downside will probably continue to 0.9265.
The mid-Pivot levels for today are as follows: M1 – 0.9273, M2 – 0.9291, M3 – 0.9309, M4 – 0.9327, M5 – 0.9345, M6 – 0.9363.
In weekly terms, the central pivot point is at 0.9306. The three key resistance levels are as follows: R1 – 0.9348, R2 – 0.9376, R3 – 0.9418. The three key support levels are: S1 – 0.9278, S2 – 0.9236, S3 – 0.9208.
The pair has entered into a trading range, following a bullish move, as a set of technical indicators plotted on the 30-minute chart above suggests. The Average Directional Index is way below the 20.00 level, while the Relative Strength Index (RSI) is below its 50.00 reading and still away from the oversold extreme. The 200-day Exponential Moving Average (EMA) has become flatter, while the 25-day and 50-day EMAs have recently been moving almost concurrently. Ranges can produce breakouts from either side.