During yesterday’s trading session USD/RUB traded within the range of 35.410-35.793 and closed at 35.694, gaining 0.33% on a daily basis.
At 7:10 GMT today USD/RUB was down 0.06% for the day to trade at 35.718. The pair touched a daily low at 35.678 at 6:15 GMT.
Fundamental view
United States
Employers in all sectors of economy in the United States, excluding the farming industry, probably added 233 000 new jobs in July, according to the median forecast by experts, after a job gain of 288 000 in June. The non-farm payrolls report presents the total number of US employees in any business, excluding the following four groups: farm employees, general government employees, employees of non-profit organizations, private household employees. The reading, released most often, varies between + 10 000 and as much as + 250 000 at times when economy is performing well. Despite the volatility and the possibility of large revisions, the non-farm payrolls indicator presents the most timely and comprehensive reflection of the current economic state. Total non-farm payrolls account for 80% of the workers, who produce the entire Gross Domestic Product of the United States. In case of a larger-than-expected gain in jobs, the US dollar would receive a boost.
Average Hourly Earnings probably increased 0.2% in July compared to the prior month, when earnings rose by another 0.2%.
At the same time, the rate of unemployment in the country probably remained unchanged at 6.1% in July. It represents the percentage of the eligible work force that is unemployed, but is actively seeking employment. A person who is not classified as employed or unemployed is excluded from the statistics. One counts as unemployed, if he falls in all of the following categories: he/she was unemployed during the last week; he/she is able bodied; he/she has been seeking employment for a period of at least four weeks, which end during the week when the research is conducted. People, who have been laid off and are awaiting to be hired again, are also classified as unemployed. In case the unemployment rate met expectations or even fell further, this would have a bullish effect on the greenback. The Bureau of Labor Statistics will release the official employment data at 12:30 GMT.
The monthly survey by Thomson Reuters and the University of Michigan may show that consumer confidence in the United States improved in July. The final reading of the corresponding index, which usually comes out two weeks after the preliminary data, probably rose to 82.0 during July from 81.3 in June. The survey encompasses about 500 respondents throughout the country. The index is comprised by two major components, a gauge of current conditions and a gauge of expectations. The current conditions index is based on the answers to two standard questions, while the index of expectations is based on three standard questions. All five questions have an equal weight in determining the value of the overall index. In case the gauge of consumer sentiment showed a larger improvement than projected, this would boost demand for the dollar. The official reading is due out at 13:55 GMT.
Activity in United States’ manufacturing sector probably continued to expand during July, with the corresponding manufacturing PMI coming in at a reading of 56.0, according to expectations, from 55.3 in June. The Manufacturing Purchasing Managers’ Index (PMI) is a compound index, which represents manufacturing activity in 20 different industries. It is comprised by four equally-weighted components: seasonally adjusted employment, seasonally adjusted production inventories, seasonally adjusted new orders and supplier deliveries. The index is based on a survey of 300 purchasing managers.
Participants can either respond with “better”, “same”, or “worse” to the questions about the industry, in which they operate. The resulting PMI value is measured from 0 to 100. If the index shows a value of 100.0, this means that 100% of the respondents reported an improvement in conditions. If the index shows a value of 0, this means that 100% or the respondents reported a deterioration in conditions. If 100% of the respondents saw no change in conditions, the index will show a reading of 50.0. Therefore, readings above the key level of 50.0 are indicative of expanding activity in the sector of manufacturing, which usually supports the US dollar. The Institute for Supply Management (ISM) is to release the official reading at 14:00 GMT.
Russian Federation
Manufacturing PMI by HSBC came in at a reading of 51.0 in July, outpacing forecasts of 48.93. In June the index stood at 49.10. Manufacturing activity in Russia reached its all-time peak in May 2012, with the PMI climbing to a reading of 53.20. The report was released at 6:00 GMT today.
Technical view
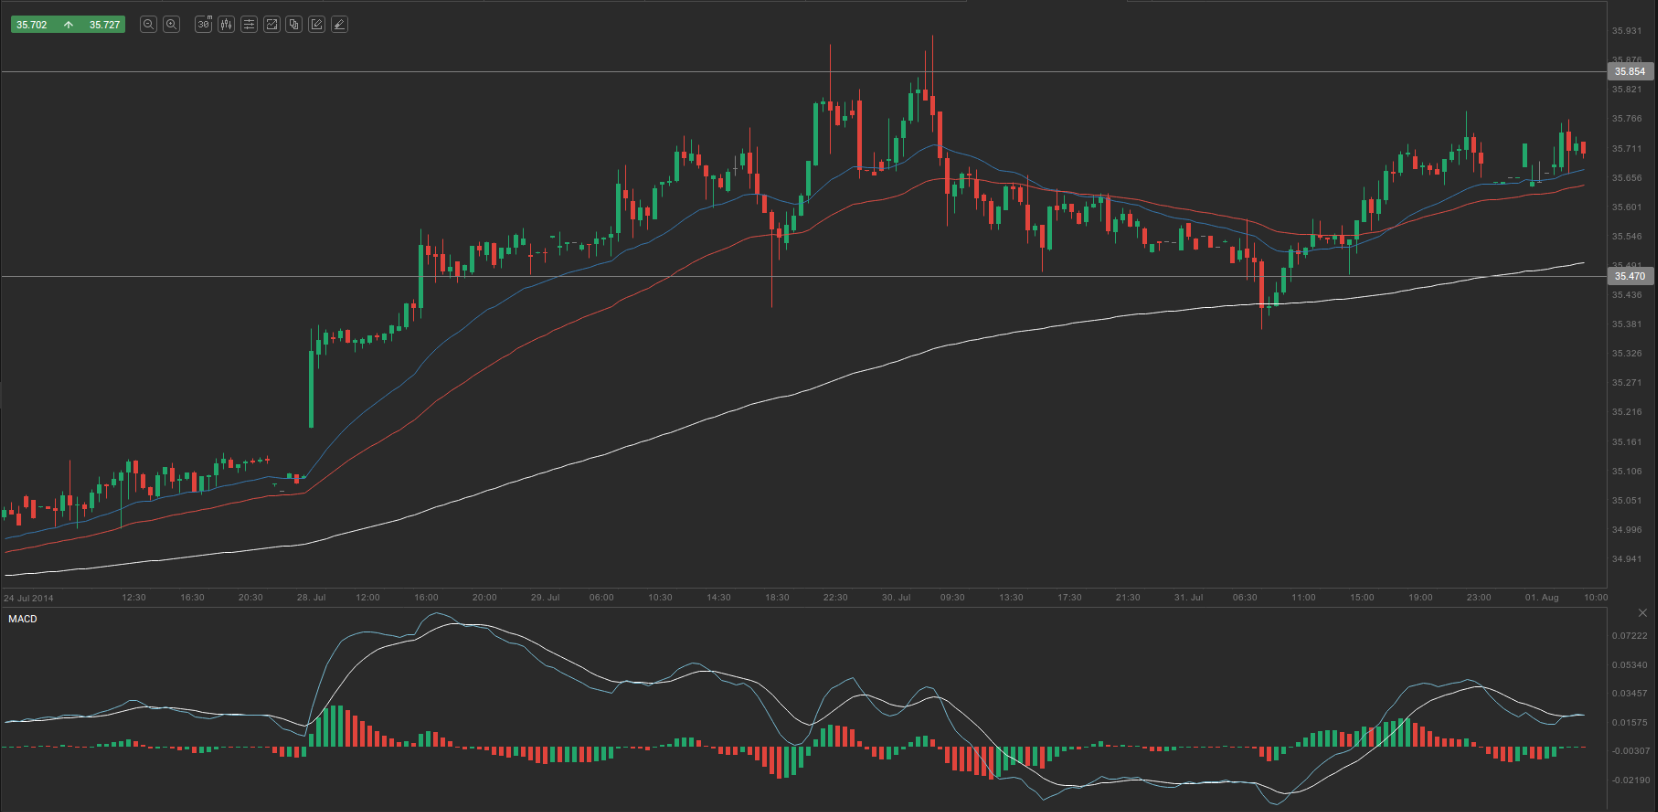
According to Binary Tribune’s daily analysis, the central pivot point for the pair is at 35.6323. In case USD/RUB manages to breach the first resistance level at 35.8547, it will probably continue up to test 36.0153. In case the second key resistance is broken, the pair will probably attempt to advance to 36.2377.
If USD/RUB manages to breach the first key support at 35.4717, it will probably continue to slide and test 35.2493. With this second key support broken, the movement to the downside will probably continue to 35.0887.
The mid-Pivot levels for today are as follows: M1 – 35.1690, M2 – 35.3605, M3 – 35.5520, M4 – 35.7435, M5 – 35.9350, M6 – 36.1265.
In weekly terms, the central pivot point is at 35.099. The three key resistance levels are as follows: R1 – 35.438, R2 – 35.743, R3 – 36.082. The three key support levels are: S1 – 34.794, S2 – 34.455, S3 – 34.150.