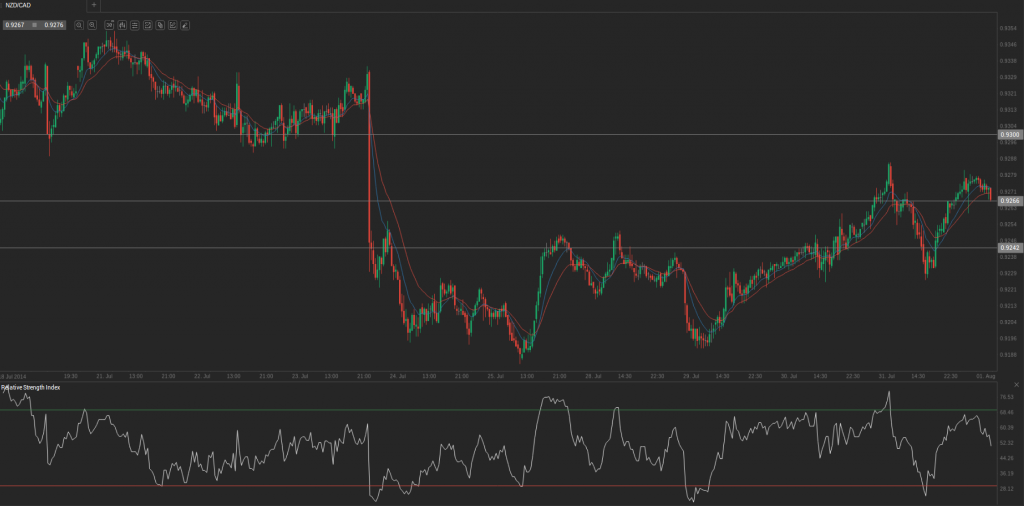
 During yesterday’s trading session NZD/CAD traded within the range of 0.9232-0.9290 and closed at 0.9276.
At 8:00 GMT today NZD/CAD was adding 0.02% for the day to trade at 0.9270. The pair touched a daily high at 0.9286 at 00:30 GMT.
Fundamental view
The RBC Canadian Manufacturing PMI probably shrank to 53.4 in July, according to the median analysts estimate, from 53.5 in the prior month, that was the strongest since November 2013.
The report on the RBC PMI for Manufacturing in Canada is based on data collected from monthly replies to questionnaires sent to supply managers in over 400 industrial companies. RBC PMI is a composed index based on five individual indexes: new orders, production, employment, delivery time, stocks of purchases. Values of the index above the key level of 50.0 indicate overall increase in the activity in the sector, while readings below 50.0 are indicative of contraction in the sectors activity. PMI studies are earlier indicators of economic conditions published each month, therefore, are available much before the publication of relevant data from government authorities.
Royal Bank of Canada will release an official report at 13:30 GMT. In case, activity in the sector shrank less than expcted, this would boost loonies demand.
Technical view
According to Binary Tribune’s daily analysis, the central pivot point for the pair is at 0.9266. In case NZD/CAD manages to breach the first resistance level at 0.9300, it will probably continue up to test 0.9324. In case the second key resistance is broken, the pair will probably attempt to advance to 0.9358.
If NZD/CAD manages to breach the first key support at 0.9242, it will probably continue to slide and test 0.9208. With this second key support broken, the movement to the downside will probably continue to 0.9184.
In weekly terms, the central pivot point is at 0.9266. The three key resistance levels are as follows: R1 – 0.9345, R2 – 0.9437, R3 – 0.9516. The three key support levels are: S1 – 0.9174, S2 – 0.9095, S3 – 0.9003.


