Apple Inc. has been in a bull trend since mid-April. On April 23rd, companys earnings report regarding the first quarter of the year was released, outstripping market expectations. On April 24th the huge gap from the open of the trading session led to the acceleration of the uptrend. The latter was confirmed by the perfect order of the 20-day, 50-day and 100-day Exponential Moving Averages.
The price overshot the 20-day EMA in late June and a respected trend line in mid-June, completing a pullback in the major trend, after which it moved back above the EMA. Since the beginning of July a rectangle-like pattern (area suggesting indecision in the market) has been forming on the daily chart. In mid-July AAPL overshot both the 20-day EMA and a significant trend line, but after that managed to climb again above the moving average on the back of the upbeat earnings report for Q2.
As the trend was plainly bullish before the rectangle-like formation in progress, after the completion of the figure we have a reason to expect a breakout to the upside from the upper boundary of the pattern. Additional evidence is that the order of the three Exponential Moving Averages remains still intact.
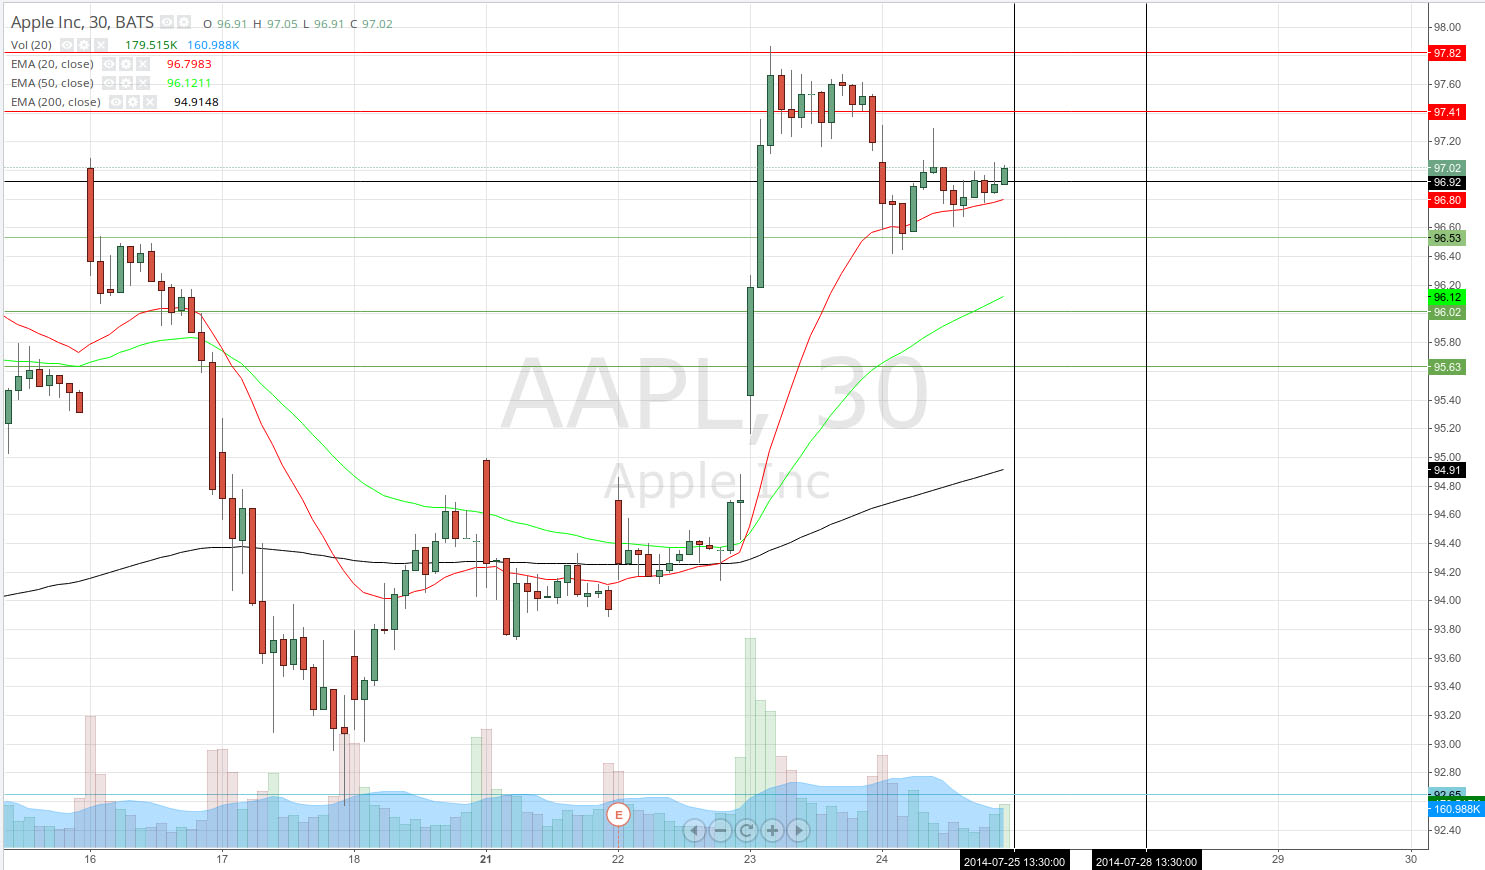
Dropping down to the 30-minute chart, we see a possible sign of a bullish breakout from the aforementioned rectangle formation. After gapping up on July 23rd, the market moved to form what could possibly be a bull flag continuation pattern. Following the gap up and the three climactic bull trend bars up, Apple entered a consolidation area near the 20-period EMA and closed higher on July 24th.
According to Binary Tribunes daily analysis, the central pivot point for July 25th stands at $96.92 (black line). In case the market opens above that level, it could set a bullish tone for the day, allowing the market to try and finish the bull flag pattern. First resistance level will be encountered at $97.41 (first red line), while R2 stands at $97.82 and R3 will be encountered at $98.33. A continuation pattern stands an even higher chance of occurring given the proper arrangement of the three EMAs for a strong bull trend.
However, if the price declines beneath the central pivot point, first support level will be encountered at $96.53, followed by S2 at $96.02 and the 50-period EMA along the way. In case all of them fail to contain the price, downward movement could extend to S3 at $95.63.