Key Moments
- AUD/USD trades comfortably above 0.7100 after filling a modest gap-down open on Monday, but follow-through buying remains limited.
- Expectations for a near-term RBA rate hike support the Australian Dollar, while a firm US Dollar and geopolitical tensions restrain gains.
- Technical levels show initial resistance near 0.7149 and support around 0.7095, with broader structure anchored by the 100-day SMA at 0.7078.
Market Overview
The AUD/USD pair recovered from a modest gap lower at the start of Monday’s session, drawing interest from dip-buyers and holding well above the 0.7100 handle through Asian trading. Despite the early rebound, buyers have not extended the move meaningfully, with market participants choosing to stay cautious ahead of several key risk events later in the week.
Traders are closely watching an upcoming speech by Reserve Bank of Australia (RBA) Governor Michele Bullock on Tuesday, followed by the release of Australian labor market data and the anticipated meeting between Donald Trump and Xi Jinping in the latter part of the week. The confluence of these events is keeping positioning restrained in the near term.
Macro Drivers and Policy Backdrop
Expectations that the RBA could implement an interest rate increase this month continue to provide underlying support for the Australian Dollar. At the same time, the US Dollar is finding a floor as the US Federal Reserve maintains a hawkish stance and tensions in the Middle East intensify, helping to halt Friday’s pullback from the greenback’s highest level since late July. This combination is limiting the scope for a more pronounced advance in AUD/USD for now.
Technical Picture: Key Levels in Focus
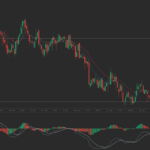
From a technical standpoint, AUD/USD retains a mildly constructive short-term tone. Spot prices have recently defended the 100-day Simple Moving Average (SMA) at 0.7078 and are trading above the 38.2% Fibonacci retracement of the June-September rally. This suggests that the primary trend floor remains intact despite the recent consolidation.
Momentum indicators are mixed. The Relative Strength Index (RSI) is hovering near 48, signaling broadly neutral conditions, while the Moving Average Convergence Divergence (MACD) indicator is slightly negative. This configuration points to a scenario in which any additional upside may unfold in a measured fashion rather than via sharp, impulsive gains, even though the pair is holding above key trend support.
Critical Support and Resistance Zones
The immediate upside hurdle is seen at the 23.6% Fibonacci retracement around 0.7149. Above that, a more substantial obstacle lies at the recent swing high near 0.7237. A clear move through this latter level would serve to strengthen the broader constructive bias for the pair.
On the downside, initial support is aligned with the 38.2% Fibonacci retracement at 0.7095. Below that, the 50.0% retracement at 0.7051, together with the 100-day SMA around 0.7078, offers a cluster of important demand levels. Deeper support is located at the 61.8% retracement at 0.7007 and the 78.6% retracement at 0.6944, which could attract buyers if the pair experiences a more extended pullback.
| Technical Level | Type | Price |
|---|---|---|
| Recent swing high | Resistance | 0.7237 |
| 23.6% Fibonacci retracement | Resistance | 0.7149 |
| 38.2% Fibonacci retracement | Support | 0.7095 |
| 100-day Simple Moving Average (SMA) | Support | 0.7078 |
| 50.0% Fibonacci retracement | Support | 0.7051 |
| 61.8% Fibonacci retracement | Support | 0.7007 |
| 78.6% Fibonacci retracement | Support | 0.6944 |
 TradingPedia.com is a financial media specialized in providing daily news and education covering Forex, equities and commodities. Our academies for traders cover