Key Moments
- Tesla Tokenized Stock is trading at $347.82, below its SMA 7 of $349.83 and SMA 20 of $348.23, with an RSI at 50.67 and a flat MACD histogram signaling fading upside momentum.
- Long positioning is heavily skewed, with retail 71.5% long and top traders 75.1% long, while a taker buy/sell ratio of 0.8578 shows aggressive sell orders dominating.
- Analysts see a higher probability of a move toward $335–$341 if $344.83 support fails, compared with a slower, less likely advance toward $365–$370 under the current technical setup.
Technical Structure: Momentum Is Losing Steam
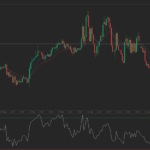
At $347.82, Tesla Tokenized Stock (TSLA) is trading underneath both its short-term simple moving averages, with the SMA 7 at $349.83 and the SMA 20 at $348.23. This configuration points to weakening short-term price strength, as buyers are no longer able to keep the tokenized stock above these near-term benchmarks.
The relative strength index (RSI) stands at 50.67, signaling a neutral condition that is neither oversold enough to attract aggressive dip buyers nor overbought enough to justify further enthusiasm. On its own, this would suggest balance, but the message shifts when viewed alongside the MACD histogram, which has compressed to a flat profile. That combination highlights a market where the prior bullish leg, which drove TSLA above the SMA 50 at $343.25, has essentially run out of momentum.
Bollinger Bands confirm this stalemate. TSLA is trading near the midpoint of the band, with the upper band at $366.15 and the lower band at $330.31. From a mean-reversion standpoint, there is no clear directional advantage. However, the alignment of short-term moving averages implies that the bias currently tilts toward a move down in the direction of the lower band rather than a push toward the upper band.
This pattern, where price hovers around the middle Bollinger Band while momentum indicators flatten, is often seen as a pre-breakdown consolidation, with a tendency to resolve in a directional move. Given the present configuration, the balance of risk is skewed to the downside.
The longer-term picture is defined by the SMA 200 at $383.77, which is roughly $36 above the current price. TSLA remains in a recovery phase relative to this key long-term average. In the absence of a substantial fundamental catalyst, a sustained move back above the SMA 200 is characterized as a project that could require an extended period rather than an immediate technical rebound.
| Indicator | Value | Implication |
|---|---|---|
| Last price | $347.82 | Below short-term moving averages |
| SMA 7 | $349.83 | Near-term trend level overhead |
| SMA 20 | $348.23 | Short-term structure turning lower |
| SMA 50 | $343.25 | Recent bullish leg lifted price above this level |
| SMA 200 | $383.77 | Long-term resistance, well above current trade |
| RSI | 50.67 | Neutral momentum, no extreme condition |
| Bollinger upper band | $366.15 | Upside volatility boundary |
| Bollinger lower band | $330.31 | Downside volatility boundary, current risk magnet |
Positioning, Flow, and Volume: A Classic Long Squeeze Setup
Positioning data show a market leaning heavily to one side. Retail traders are 71.5% net long, and top traders are even more extended at 75.1% long. Open interest has increased by 1.97% over the past 24 hours, bringing notional exposure above $41.3 million. At first glance, this might be read as firm bullish conviction.
However, the taker buy/sell ratio at 0.8578 signals that aggressive sell orders are currently exceeding aggressive buy orders. This divergence between positioning and actual order flow is typical of conditions that can precede a long squeeze, where an overcrowded long side meets persistent selling pressure.
The funding rate of 0.0095% remains low, suggesting that long positions are not yet facing significant funding stress. Even so, this level is consistent with an environment where many traders are on the same side of the trade just before a shakeout, rather than one where risk has already been flushed from the system. With sellers active in the tape while the majority is positioned long, it appears that some participants may be distributing exposure into ongoing optimism.
Spot trading volume over 24 hours is around $21 million, which is described as modest. There is no evidence of a strong volume spike that would normally accompany a robust breakout. Instead, the increase in open interest is interpreted as longs being added into price weakness rather than as broad-based institutional buying in anticipation of a major catalyst.
Historical observations on tokenized equity markets referenced by Blockchain.news note similar divergences between derivatives open interest and the price behavior of related underlying equities, where leverage built ahead of actual equity moves and was later forced to realign with shorter-term equity trends.
| Metric | Value | Interpretation |
|---|---|---|
| Retail long ratio | 71.5% | Crowded long retail positioning |
| Top trader long ratio | 75.1% | Even more skewed toward longs |
| Open interest change (24h) | +1.97% | More capital committed to existing trend |
| Open interest notional | >$41.3 million | Material exposure in derivatives |
| Taker buy/sell ratio | 0.8578 | Aggressive sellers outweigh buyers |
| Funding rate | 0.0095% | Low but supportive of persistent long bias |
| Spot volume (24h) | ~$21 million | Modest, not breakout-level activity |
 TradingPedia.com is a financial media specialized in providing daily news and education covering Forex, equities and commodities. Our academies for traders cover