Key Moments
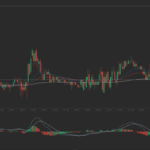
- BTC/USD is trading at $63,228 on the 1-hour chart, sitting just below a key resistance zone at $63,447.
- Momentum indicators are turning cautious, with a MACD bearish crossover and declining volume as price inches higher.
- Defined trade setups outline bullish, conservative, and breakdown strategies, while $62,800–$63,400 is flagged as a no-trade compression range.
Intraday Snapshot: Price Stalls Below Resistance
As of the latest update on Jun 08, 2026 at 09:10 AM UTC, Bitcoin (BTC/USD) is quoted at $63,228 on the 1-hour chart. The price is locked just beneath a significant resistance level at $63,447, where overhead supply is limiting further upside. The current structure reflects a neutral stance with a slight bullish lean, as price has climbed above key short-term levels but is losing momentum into this resistance area.
The setup is finely balanced: either a failed breakout could trap late buyers, or a decisive move through resistance could fuel a continuation higher. The next scheduled update is set for Jun 08, 2026 at 10:10 AM UTC, with this analysis refreshed hourly during market hours.
Bull Trap Risk vs Potential Breakout
The central tactical risk is the possibility of a bull trap near $63,447, identified as the VPVR Point of Control, where recent trading volume has been heaviest. A reversal from this zone could quickly reassert the broader downtrend.
Momentum conditions are turning cautious. The MACD has registered a bearish crossover, with the MACD line at 352.98 now below the signal line at 392.98, pointing to fading upside strength. At the same time, trading volume is thinning as price pushes higher, a classic sign that buyer conviction may be weakening.
Strategy Playbook: Defined Entry, Stop, and Target Levels
The following intraday setups outline where trades may be considered, including entry triggers, stop levels, and target zones. Risk-reward (R:R) metrics and trader profiles are also provided.
| Entry Variation | Entry Trigger | Stop Level | Targets (R:R) | Confidence | Best For |
|---|---|---|---|---|---|
| Aggressive | 1h close > $63,350 | $62,800 | $64,200 (1.55), $64,700 (2.45) | Medium | Active breakout traders |
| Conservative | Pullback to $62,750 | $62,200 | $63,800 (1.91), $64,700 (3.55) | Medium | Patient swing traders |
| Breakdown | 1h close < $61,607 | $62,300 | $60,000 (1.88), $59,200 (2.88) | Medium | Trend followers |
Post-Entry Scenarios
On the upside, if BTC/USD can close above $63,350 on the 1-hour timeframe with strong accompanying volume, a swift move toward the $64,200 to $64,700 region is anticipated. However, any hesitation or fresh decline in volume after the breakout would be a warning sign. In that case, the guidance is to shift stops to breakeven after the first target (T1) is reached.
On the downside, a confirmed 1-hour close under $61,607 combined with rising ADX could fuel accelerated selling pressure. Traders are advised to remain alert to the possibility of a brief fake-out before a more pronounced reversal develops.
No-Trade Compression Zone
The band between $62,800 and $63,400 is highlighted as a no-trade area. Price action in this corridor is described as compressed, suggesting indecision and limited directional edge. The playbook recommends waiting for a clear break above or below this range, supported by volume expansion, before committing capital.
Technical Structure and Pattern Progress
Several technical tools frame the current setup:
- SuperTrend: This indicator has turned bullish, flipping higher at $61,607. The signal is considered valid as long as buyers maintain price action above that level.
- Ichimoku Cloud: BTC/USD is currently trading above the cloud, which spans $62,234 to $62,869, indicating a bullish near-term structure. However, the narrowing of this range points to rising indecision.
- MACD: The bearish cross, with the MACD line at 352.98 below the signal line at 392.98, underscores stalling momentum and often aligns with exhaustion following a rally.
- Volume: Declining volume as price rises suggests that the advance is being driven by fewer participants, increasing the risk that the move could falter.
- Inverse Head & Shoulders: An inverse head and shoulders formation is described as 75% complete. The pattern is only considered confirmed if price can sustain a move above $63,800 with strength.
Risk Management and Invalidation Levels
Volatility metrics and invalidation thresholds are central to the trade plan. The ATR stands at $549.85, implying that even relatively modest intraday moves can translate into sizable dollar swings. Position sizing should be adjusted to account for this.
For bullish scenarios, a drop below $59,159 is flagged as invalidating the current uptrend thesis. From the bearish perspective, a move above $64,724 would overturn the downside view and “flip the script.”
Trade management guidance includes moving stops to the entry level once the first profit target (T1) is hit and then trailing stops below recent hourly lows after the second target (T2) is achieved.
Core Takeaway for Traders
The overarching message is to avoid entering trades directly into resistance when momentum is deteriorating. The recommended approach is to wait for confirmation: either a breakout accompanied by strong volume, or a downside move with expanding ATR and ADX. In tight, range-bound conditions, maintaining patience is emphasized as a key advantage.