Key Moments
- USD/JPY is consolidating near 155 after a sharp pullback from the 158–159 area, with the broader medium-term uptrend still intact.
- Price is trading just above the 15-day and 20-day moving averages, while the 14-day RSI has normalized around neutral levels.
- The 155 region is acting as a tactical pivot, with support at 154.50–154.70 and resistance at 156.00–156.50 and 158.50–159.00.
Trend Structure: Uptrend Intact, but Pace Has Eased
USD/JPY is attempting to stabilize around the 155 level following a sharp corrective slide from the 158–159 region. The broader price structure on the daily chart continues to point to an ongoing medium-term uptrend, but the recent price behavior indicates a shift into a transitional phase between corrective weakness and a possible resumption of the prior bullish trend.
The underlying trend remains constructive, with a pattern of higher highs and higher lows still visible on the daily timeframe. The 150–152 area continues to serve as a key structural support zone, and recent declines have retained a corrective character rather than displaying the characteristics of an impulsive trend reversal. The sharp retreat toward 152 appears more consistent with a positioning washout than with a break in the prevailing bullish structure. Even so, upside momentum has clearly slowed since the earlier rally peak near 159.
Moving Averages: Compression Highlights an Inflection Zone
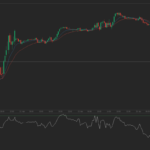
Spot USD/JPY is currently trading just above both the 15-day and 20-day moving averages. These averages, which had turned lower, are now flattening out, signaling a period of compression and consolidation.
This configuration points to a short-term pause in directional movement, with reduced momentum and the potential for a volatility expansion as the pair exits this consolidation phase. Price behavior around the 155 area is therefore critical. Sustained trading above 155.50 would lean the bias back toward renewed upside momentum, while a move back below 154.50 would increase the risk of another decline toward the 152–153 band.
Momentum: RSI Moves Back to Neutral
The 14-day Relative Strength Index has recovered toward the 50 mark, suggesting that prior oversold conditions have been largely unwound. This normalization indicates waning bearish pressure and a broader transition into neutral momentum territory.
A continued push by RSI into the 55–60 range would strengthen the case for a bullish continuation and a resumption of the broader uptrend. Conversely, if RSI rolls back below 45, it would point to a re-emergence of downside risks and the potential for renewed selling pressure.
Key Technical Levels
Several nearby support and resistance zones are defining the tactical landscape for USD/JPY.
| Level Type | Zone | Comment |
|---|---|---|
| Immediate Support | 154.50–154.70 | Backed by short-term moving averages and acting as the first line of downside defense. |
| Secondary Support | 152.00–152.50 | Recent corrective low and a key structural pivot within the broader uptrend. |
| Near-Term Resistance | 156.00–156.50 | A break above this band would open scope for a move toward the 158 area. |
| Major Resistance | 158.50–159.00 | Cycle highs and a critical barrier within the prevailing bullish structure. |
Macro Context: Yield Differentials as the Key Driver
Price action in USD/JPY continues to be anchored by yield and policy differentials. The pair is primarily reacting to movements in US Treasury yields, shifts in market expectations for Federal Reserve policy, and perceptions of Bank of Japan policy normalization risks.
As long as US yields remain relatively elevated and changes in Bank of Japan policy are seen as gradual, the structural downside in USD/JPY may remain constrained. However, episodes of heightened volatility related to Japanese policy communication or abrupt declines in US yields could trigger renewed downside pressure on the pair.
Outlook: Consolidation Around a Critical Pivot
USD/JPY is trading in a consolidation phase within its broader uptrend, with the 155 region acting as a tactical pivot and near-term battleground. The pair is effectively coiling rather than delivering a clear reversal signal.
- Above 156: A bullish continuation toward 158 becomes the more likely scenario.
- Below 154.50: Odds increase for a retest of support in the 152 area.
- Below 152: The integrity of the broader trend structure would begin to erode.
At this stage, USD/JPY remains underpinned by its structural uptrend, but short-term conditions reflect consolidation. With momentum indicators stabilizing and moving averages flattening, the next decisive break above resistance or below support is likely to determine whether the dominant uptrend reasserts itself or whether the corrective phase extends.