Join our community of traders FOR FREE!

  • Learn
  • Improve yourself
  • Get Rewards
Learn More

The common currency extended losses against the US Dollar on Tuesday and came another step closer to parity due to concerns an EU energy crisis could drive local economies towards recession.

At the same time, the greenback continued to be underpinned by expectations of more aggressive interest rate hikes by the Federal Reserve compared to other central banks.

“Haven demand for USD, coupled with an upside surprise in last Friday’s payrolls release, likely contributed to the latest bout of dollar strength,” analysts at Maybank wrote in an investor note.

As a result, the EUR/USD pair remained pressured near a 20-year low and close to parity.

The largest single pipeline that delivers Russian gas to Germany, the Nord Stream 1, began annual maintenance on Monday. Gas flows will be discontinued for 10 days, but still, there are concerns the shutdown could be extended due to the military conflict in Ukraine.

“The most proximate concern for markets is whether or not Nord Stream 1 is going to come back online,” Bipan Rai, North American head of FX strategy at CIBC Capital Markets, was quoted as saying by Reuters.

If it does not, “the markets will likely price in a recession” for the region, Rai said.

Meanwhile, the Federal Reserve is expected to hike rates by 75 basis points at its policy meeting on July 26th-27th, as it seeks to curb high inflation.

Futures markets are now pricing for US interest rates to reach 3.50% by March 2023.

“The Fed is going to raise rates more aggressively than most other developed market central banks and we don’t think other developed market central banks really have the bandwidth to keep up,” CIBC Capital Markets’ Bipan Rai noted.

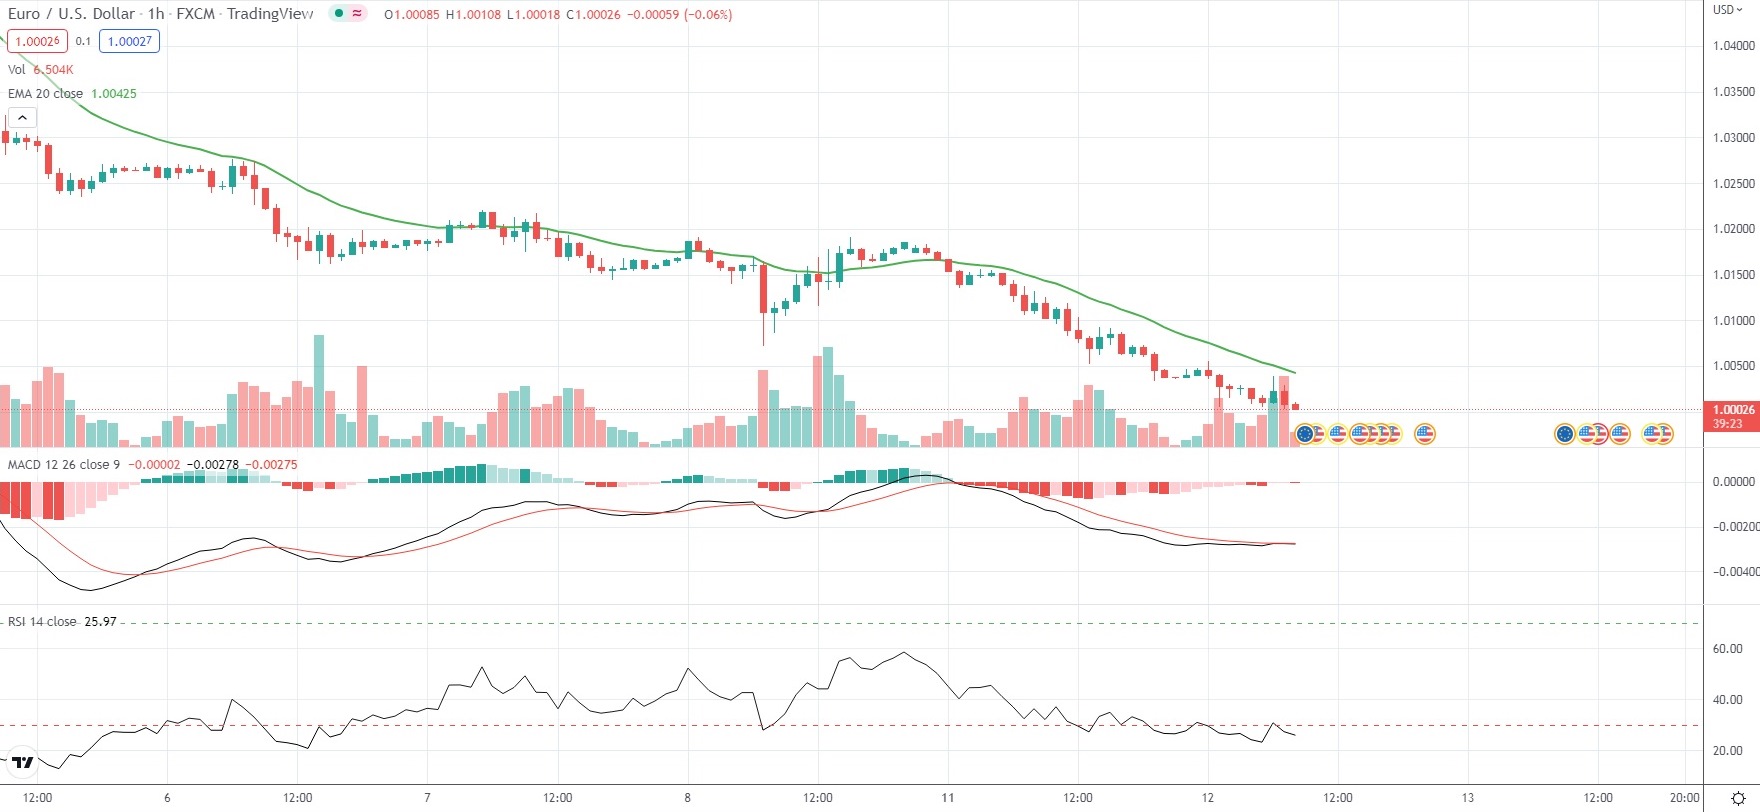
As of 8:18 GMT on Tuesday EUR/USD was edging down 0.35% to trade at 1.0003. Earlier in the European trading session, the major Forex pair slipped as low as 1.0002, which has been its weakest level since December 6th 2002 (1.00001).

EUR/USD has retreated 4.55% so far in July, following another 2.31% loss in June.

Daily Pivot Levels (traditional method of calculation)

Central Pivot – 1.0085
R1 – 1.0137
R2 – 1.0235
R3 – 1.0286
R4 – 1.0338

S1 – 0.9987
S2 – 0.9935
S3 – 0.9837
S4 – 0.9739

TradingPedia.com is a financial media specialized in providing daily news and education covering Forex, equities and commodities. Our academies for traders cover Forex, Price Action and Social Trading.

Related News

  • Singapore’s June non-oil exports plunge 8.7%Singapore’s June non-oil exports plunge 8.7% Singapore’s non-oil domestic exports were reported to have dropped 8.7% year-on-year in June, while marking the fifth straight month of decline.The data followed a revised 0.7% contraction in May.A consensus of analyst estimates […]
  • South Africa’s CPI inflation lowest since December 2023South Africa’s CPI inflation lowest since December 2023 Annual consumer price inflation in South Africa has eased to 5.1% in June from 5.2% in the preceding two months, data by Statistics South Africa showed.It has been the lowest inflation rate since December 2023.Last month, inflation […]
  • Oil trading outlook: WTI futures erase daily gains on bearish US supply dataOil trading outlook: WTI futures erase daily gains on bearish US supply data US crude fell sharply on news that stockpiles in the United States rose more than expected the week ended April 18th, erasing earlier gains. Brent also felt negative sentiment and slid to session low.On the New York Mercantile Exchange WTI […]
  • Forex Market: USD/JPY trades little changed after BoJ keeps monetary policy on holdForex Market: USD/JPY trades little changed after BoJ keeps monetary policy on hold The yen traded little changed against the US dollar on Tuesday, after the Bank of Japan kept record easing, before an April sales-tax increase that may trigger the worst one-quarter contraction since the March 2011 earthquake.USD/JPY hit […]
  • Forex Market: USD/CAD daily trading outlookForex Market: USD/CAD daily trading outlook Yesterday’s trade saw USD/CAD within the range of 1.2941-1.3134. The pair closed at 1.2989, falling 0.83% on a daily basis. It has been the 26th drop in the past 53 trading days and also a second consecutive one. The daily low has been the […]
  • Forex Market: USD/MXN daily trading forecastForex Market: USD/MXN daily trading forecast Friday’s trade saw USD/MXN within the range of 13.5930-13.6737. The pair closed at 13.6200, losing 0.23% on a daily basis.At 9:06 GMT today USD/MXN was up 0.17% for the day to trade at 13.6395. The pair touched a daily high at 13.6431 at […]