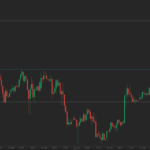
 Friday’s trade saw USD/CAD within the range of 1.3793-1.3842. The pair closed at 1.3822, inching up 0.03% on a daily basis and following three consecutive trading days of losses. The daily low has been the lowest level since December 17th, when a low of 1.3774 was registered. In weekly terms, USD/CAD depreciated 0.95% last week, while marking its first drop in the past three weeks and also the sharpest one since the week ended on October 11th, when a 1.57% slump was recorded. USD/CAD has appreciated 3.86% so far during the current month, following a 2.17% surge in November.
At 10:40 GMT today USD/CAD was gaining 0.19% for the day to trade at 1.3879. The pair touched a daily high at 1.3881 at 10:17 GMT and a daily low at 1.3817 during early Asian trade. Support may be received at the hourly 55-period EMA (1.3866) and after that – in the area around the current low for the day. Resistance may be encountered at the psychological 1.3900 level and after that – at the high from December 23rd (1.3936).
The Canadian dollar has recently been heavily influenced by a continuous decline in prices of oil. Crude oil futures for February delivery were down 1.66% on the day to trade at $37.27 per barrel as of 10:34 GMT, after falling to as low as $37.22 earlier. Oil has declined in 11 out of the past 19 trading days. On December 21st the commodity touched a daily low of $33.98 a barrel, which has been the lowest price level since February 13th 2009, when oil futures plunged as low as $33.81 per barrel. Crude oil has lost 10.58% of its value so far in December.
No relevant macroeconomic reports and other events, which may have an impact on USD/CAD trading, are scheduled for release on Monday.
Correlation with other Majors
Taking into account the week ended on December 27th and the daily closing levels of the major currency pairs, we come to the following conclusions in regard to the strength of relationship:
USD/CAD to USD/JPY (0.9036, or very strong)
USD/CAD to USD/CHF (0.5040, or strong)
USD/CAD to EUR/USD (-0.5409, or strong)
USD/CAD to GBP/USD (-0.6278, or strong)
USD/CAD to AUD/USD (-0.8182, or very strong)
USD/CAD to NZD/USD (-0.8430, or very strong)
1. During the examined period USD/CAD moved strongly in one and the same direction with USD/CHF, while moving strongly in the opposite direction compared to EUR/USD and GBP/USD.
2. USD/CAD moved almost equally in one and the same direction with USD/JPY during the past week, while moving almost equally in the opposite direction compared to AUD/USD and NZD/USD.
Bond Yield Spread
The yield on Canada’s 2-year government bonds went as high as 0.515% on December 24th, after which it closed at 0.487% to lose 2 basis points (0.02 percentage point) compared to December 23rd. It has been the 14th drop in the past 24 trading days and also a second consecutive one.
The yield on US 2-year government bonds climbed as high as 1.011% on December 24th, or the highest level since December 17th (1.017%), after which it closed at 1.006% to add 1.7 basis points (0.017 percentage point) compared to December 23rd. It has been the 20th gain in the past 29 trading days and also a third consecutive one.
The spread between 2-year US and 2-year Canadian bond yields, which reflects the flow of funds in a short term, widened to 0.519% on December 24th from 0.482% on December 23rd. The December 24th yield spread has been the largest one in at least eight months.
Meanwhile, the yield on Canada’s 10-year government bonds soared as high as 1.429% on December 24th, after which it slid to 1.379% at the close to lose 3.7 basis points (0.037 percentage point) compared to December 23rd. It has been the 15th drop in the past 24 trading days.
The yield on US 10-year government bonds climbed as high as 2.266% on December 24th, after which it slipped to 2.245% at the close to lose 1.4 basis points (0.014 percentage point) compared to December 23rd. It has been the 18th drop in the past 29 trading days.
The spread between 10-year US and 10-year Canadian bond yields widened to 0.866% on December 24th from 0.843% on December 23rd. The December 24th yield difference has been the largest one in at least eight months.
Daily and Weekly Pivot Levels
By employing the Camarilla calculation method, the daily pivot levels for USD/CAD are presented as follows:
R1 – 1.3826
R2 – 1.3831
R3 (range resistance) – 1.3835
R4 (range breakout) – 1.3850
S1 – 1.3818
S2 – 1.3813
S3 (range support) – 1.3809
S4 (range breakout) – 1.3795
By using the traditional method of calculation, the weekly pivot levels for USD/CAD are presented as follows:
Central Pivot Point – 1.3870
R1 – 1.3948
R2 – 1.4073
R3 – 1.4151
S1 – 1.3745
S2 – 1.3667
S3 – 1.3542


